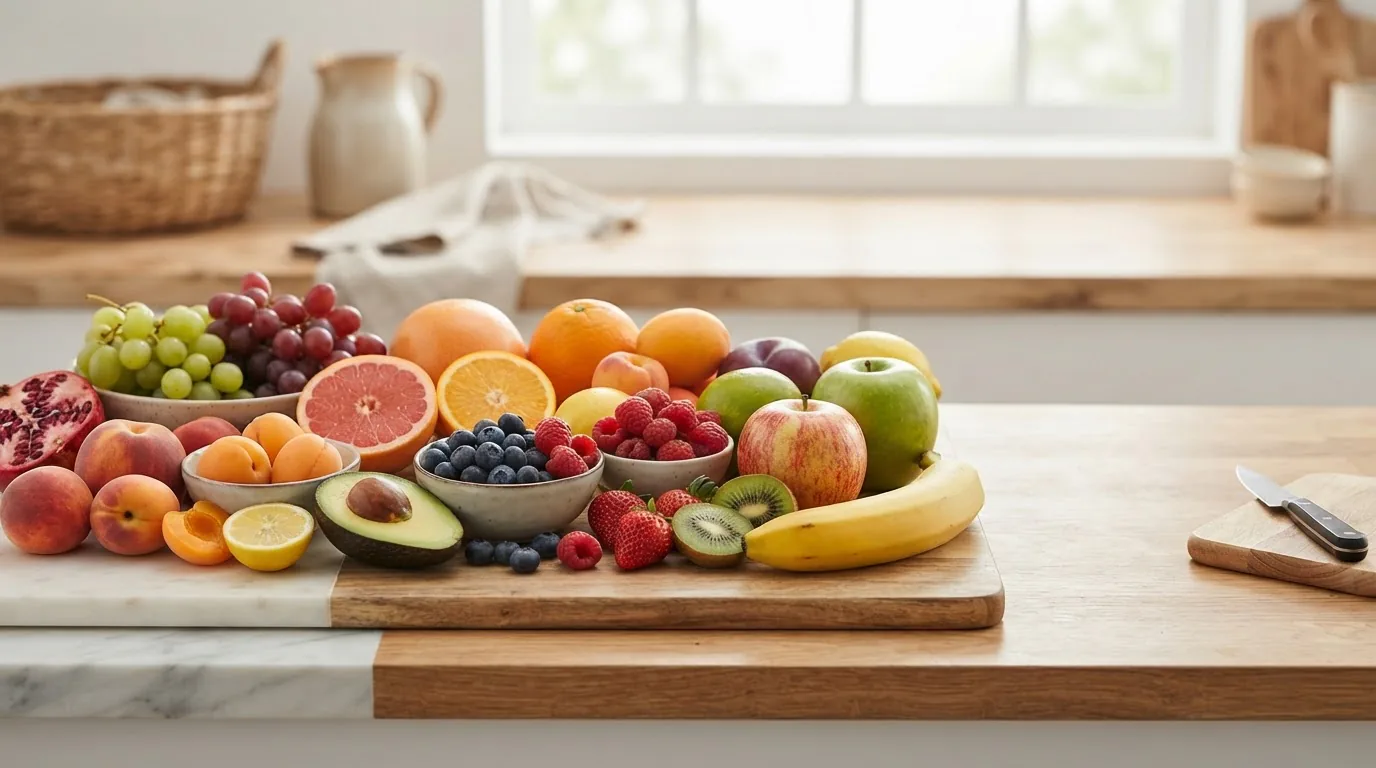
Fruit chart essentials in one place: this guide gives serving sizes, calories, carbs, fiber and vitamin data for common raw fruits, plus practical portion tips (like how many grapes make a serving) to help you plan meals and track nutrients easily.
Introduction to Fruit Charts and Their Importance
A clear fruit chart is a compact, reliable reference that translates raw nutrient data into usable portions for everyday eating and meal planning. For consumers and diet trackers alike, a chart that lists standard serving sizes, calories, carbohydrates, fiber and key vitamins/minerals removes guesswork and supports healthier choices.
Nutrition databases report fruits by weight or common household measures (cups, medium pieces). Understanding how those measures relate to servings helps you compare fruits, manage calories and carbohydrates, and prioritize nutrient-dense options. According to the 2025 USDA FoodData Central, standardized serving sizes (e.g., 1 medium apple ≈ 182 g) allow consistent comparisons across fruits.
This guide is built to be a one-stop reference for raw fruits — not juices or recipes — and connects portion guidance to real household examples, measurement techniques, and meal-planning steps. For broader context on fruit types and overall benefits, see Types of Fruit Guide: Fresh Fruits and Vegetables Benefits
Transition: Now that you know why a fruit chart matters, let’s break down serving sizes for common fruits and what those servings actually look like in real life.
Understanding Serving Sizes for Common Fruits
Serving sizes can be defined by weight (grams), volume (cups), or pieces (one medium apple). Nutrition labels typically use USDA standards that reflect a “standard serving of fruit,” often listed as 1/2 cup (canned or fresh pieces), 1 medium whole fruit, or 1/4 cup dried. These standards help with calorie and macronutrient comparisons.
Below is a numbered list of typical servings for 15 popular raw fruits with clear household examples so you can visualize portions at a glance. Serving sizes and nutrient numbers are based on common measures and USDA FoodData Central entries (2025) unless otherwise noted; natural variation by variety, ripeness and size will change exact values.
- Apples (medium) — Typical serving: 1 medium apple (~182 g). Example: one whole apple fits in your palm. Calories: ~95 kcal. Fiber: ~4.4 g.
- Bananas (medium) — Typical serving: 1 medium banana (~118 g). Example: a banana about 7–8 inches. Calories: ~105 kcal. Fiber: ~3.1 g.
- Grapes — Typical serving: 1 cup (151 g) ≈ 15–20 grapes (medium). Example: a small handful. Calories: ~104 kcal. Fiber: ~1.4 g. (See practical note below on how many grapes per serving.)
- Oranges (medium) — Typical serving: 1 medium orange (~131 g). Example: one orange you can peel by hand. Calories: ~62 kcal. Fiber: ~3.1 g.
- Strawberries — Typical serving: 1 cup whole (144 g) ≈ 8–12 medium berries. Calories: ~49 kcal. Fiber: ~3 g.
- Blueberries — Typical serving: 1 cup (148 g). Example: a small cereal bowlful. Calories: ~84 kcal. Fiber: ~3.6 g.
- Pears (medium) — Typical serving: 1 medium pear (~178 g). Calories: ~101 kcal. Fiber: ~5.5 g.
- Peaches (medium) — Typical serving: 1 medium peach (~150 g). Calories: ~59 kcal. Fiber: ~2.3 g.
- Cherries — Typical serving: 1 cup whole (154 g) ≈ 21–25 cherries. Calories: ~97 kcal. Fiber: ~3.2 g.
- Watermelon — Typical serving: 1 cup diced (152 g). Example: two medium wedges. Calories: ~46 kcal. Fiber: ~0.6 g.
- Cantaloupe — Typical serving: 1 cup diced (160 g). Calories: ~54 kcal. Fiber: ~1.4 g.
- Honeydew — Typical serving: 1 cup diced (177 g). Calories: ~61 kcal. Fiber: ~1.4 g.
- Pineapple — Typical serving: 1 cup chunks (165 g). Calories: ~83 kcal. Fiber: ~2.3 g.
- Mango — Typical serving: 1 cup sliced (165 g). Calories: ~99 kcal. Fiber: ~2.6 g.
- Kiwifruit — Typical serving: 1 medium kiwi (~76 g). Calories: ~42 kcal. Fiber: ~2.1 g.
Practical example — serving size of grapes: A standard serving is 1 cup (151 g), which is roughly 15–20 medium grapes. For calorie counting, that serving contains about 104 kcal according to USDA FoodData Central (2025). For bite-sized portion control, a small handful equals one serving.
Measurement tips used in the list above: cup measures are useful for chopped fruits and berries; whole-fruit servings use “medium” estimates; and weight measures are best when precision matters (use a kitchen scale). Keep in mind natural variation: a large apple will have more calories than a small one.
Transition: With servings clear, next we’ll explain calorie basics and show quick comparison tables so you can see how fruits stack up energy-wise.
Calories in Fruit: What You Need to Know
Yes — fruit has calories. Calories in fruit come mainly from carbohydrate (sugars and starch) and to a small extent from protein and fat (e.g., avocado). Understanding calories per serving helps manage energy intake while preserving micronutrient benefits.
How calories are reported: Nutrition data usually expresses calories per listed serving (e.g., 1 medium fruit, 1 cup chopped). The USDA FoodData Central (2025) provides the standard kilocalorie (kcal) values used across nutrition labels in the U.S. Calorie differences between fruits arise from water content (high-water fruits like watermelon are low-calorie), sugar content, and fat (avocado is higher due to healthy fats).
Small calorie comparison tables below help you quickly compare common fruits by typical serving.
| Fruit (typical serving) | Serving size | Calories (kcal) | Notes |
|---|---|---|---|
| Apple (medium) | 1 medium (~182 g) | 95 | High fiber for satiety |
| Banana (medium) | 1 medium (~118 g) | 105 | Higher carbs; good pre-workout |
| Grapes | 1 cup (~151 g) | 104 | Easy to overeat by handfuls |
| Blueberries | 1 cup (~148 g) | 84 | Rich in antioxidants |
| Orange (medium) | 1 medium (~131 g) | 62 | Vitamin C-rich |
| Watermelon | 1 cup diced (~152 g) | 46 | Very hydrating, low-calorie |
| Avocado (medium) | 1/2 fruit (~100 g) | 160 | Higher fat, calorie-dense |
Source notes: calorie figures above reference USDA FoodData Central entries (2025) for standard serving sizes. For precise meal tracking, weigh your fruit and use the database entry for that weight.
Calories vs snacks: Compared to many processed snacks (chips, candy), raw fruits generally provide fewer calories per volume plus fiber and micronutrients. For example, a typical 1-ounce bag of potato chips contains ~150 kcal, while a cup of watermelon is only ~46 kcal (2024 industry food label averages, per a 2024 industry report).
How fruit calories are counted: multiply the grams of fruit you eat by the kcal per gram reported in your chosen database. Nutrition apps and USDA entries provide per-100 g values for quick math. Remember: dried fruits are calorie-concentrated—1/4 cup raisins (~40 g) can have ~120 kcal because water has been removed.
Transition: Calories are only part of the story — carbohydrates and fiber determine energy availability and blood sugar response. The next section compares fruits by carbs and explains glycemic impact.
Fruit Carbohydrates and Their Role in Nutrition (Including Fruits by Carbs Chart)
Most calories in fruit come from carbohydrate: simple sugars (fructose, glucose, sucrose) and indigestible carbohydrates (fiber). Understanding carbohydrate content and type helps with blood sugar management, athletic fueling, and carbohydrate budgeting for meal plans.
Key terms defined briefly: Glycemic Index (GI) ranks foods by blood-sugar response versus glucose; Glycemic Load (GL) adjusts GI for a typical serving size. Fiber slows digestion and moderates post-meal glucose spikes.
Below is a practical fruits by carbs chart showing common raw fruits sorted by approximate total carbohydrate per typical serving (grams). Values reference USDA FoodData Central (2025) per standard serving and are rounded to nearest gram.
| Fruit (serving) | Serving size | Total carbs (g) | Sugars (g) | Fiber (g) |
|---|---|---|---|---|
| Apple (medium) | 1 medium (~182 g) | 25 | 19 | 4.4 |
| Banana (medium) | 1 medium (~118 g) | 27 | 14 | 3.1 |
| Grapes | 1 cup (~151 g) | 27 | 23 | 1.4 |
| Blueberries | 1 cup (~148 g) | 21 | 15 | 3.6 |
| Orange (medium) | 1 medium (~131 g) | 15 | 12 | 3.1 |
| Watermelon | 1 cup diced (~152 g) | 11 | 9 | 0.6 |
| Strawberries | 1 cup whole (~144 g) | 11 | 7 | 3.0 |
| Mango | 1 cup sliced (~165 g) | 25 | 23 | 2.6 |
| Pineapple | 1 cup chunks (~165 g) | 22 | 16 | 2.3 |
| Avocado (half) | 1/2 medium (~100 g) | 8.5 | 0.7 | 6.7 |
Interpretation tips: Low-carb fruits (e.g., berries, watermelon) make good choices when carbohydrate control is a priority. Avocado stands out for low sugars and high healthy fat/fiber. High-carb options (bananas, grapes, mango) provide fast energy — useful around workouts but worth monitoring for glucose-sensitive diets.
For users tracking carbs precisely — for diabetes or low-carb diets — use an authoritative carb table like the carbohydrates in fruit chart for expanded listings and grams-per-weight conversions.
Glycemic basics: Most whole fruits have moderate or low GI because fiber and water dilute sugars. For example, apples and cherries have low to moderate GI scores, while ripe bananas have higher GI. For detailed GI/GL context, see a review from a reputable nutrition source (Harvard T.H. Chan School of Public Health) for fruit glycemic discussions: Harvard T.H. Chan — Fruit and Health.
Practical portion guidance: combine high-carb fruits with protein or fat (e.g., apple with nut butter) to blunt rapid glucose rises and improve satiety. For those using carb exchanges, note the serving carb values in the table and measure portions with a cup or kitchen scale.
Transition: Carbohydrates and calories answer part of the question; now let’s explore micronutrients — vitamins, minerals, and fiber — that make fruit especially valuable.
Detailed Fruit Nutrition Facts: Vitamins, Minerals, Fiber, and More
Raw fruits are important sources of micronutrients — especially vitamin C, potassium, vitamin A precursors, and dietary fiber. This section highlights key nutrients for selected fruits and explains how to use those nutrients when planning a balanced diet.
Before the nutrient table, a few expert points: fiber content varies by fruit and preparation; vitamin C degrades with heat and storage; potassium content is useful for blood pressure management. Data below are drawn from USDA FoodData Central (2025) and verified recent nutrition literature where applicable.
| Fruit (serving) | Vitamin C (mg) | Vitamin A (µg RAE) | Potassium (mg) | Fiber (g) |
|---|---|---|---|---|
| Orange (1 medium) | 70 | 12 | 237 | 3.1 |
| Strawberries (1 cup) | 89 | 1 | 220 | 3.0 |
| Apple (1 medium) | 8.4 | 3 | 195 | 4.4 |
| Banana (1 medium) | 10.3 | 3 | 422 | 3.1 |
| Blueberries (1 cup) | 14.4 | 1 | 114 | 3.6 |
| Mango (1 cup) | 60 | 54 | 277 | 2.6 |
| Pineapple (1 cup) | 79 | 2 | 180 | 2.3 |
| Kiwifruit (1 medium) | 71 | 2 | 237 | 2.1 |
| Avocado (1/2 medium) | 6.0 | 7 | 487 | 6.7 |
| Watermelon (1 cup) | 12.5 | 10 | 170 | 0.6 |
Notes and context
- Vitamin sources: citrus (oranges, strawberries, kiwi) are consistently high in vitamin C. For a broader look at vitamin distribution across foods, see vitamin sources in fruits.
- Potassium: bananas and avocados are among the higher potassium fruits — useful if following blood-pressure-lowering diets (2025 USDA FoodData Central values).
- Fiber: pears, apples (with skin), and avocados provide substantial fiber per serving; fiber supports satiety and healthy digestion.
- Antioxidants and phytonutrients: berries (strawberries, blueberries) and cherries are notable for polyphenols and anthocyanins; refer to peer-reviewed reviews for details (e.g., 2022 nutrition review). Harvard T.H. Chan — Fruit and Health
- Avocado exception: avocados are higher in calories due to healthy fats but also supply significant potassium and fiber; for a detailed profile of avocado nutrition, see avocado nutrition facts.
Determining nutrient density: Nutrient density compares a food’s vitamin/mineral content relative to its energy (calories). Berries, citrus, and kiwi are high nutrient-per-calorie fruits; avocados and bananas are nutrient-rich but more calorie-dense.
Source credibility: all numeric nutrient values above use USDA FoodData Central (2025) entries. For guidance on interpreting nutrient claims and labels, consult government resources like the CDC for dietary guidelines: CDC Nutrition.
Transition: With nutrient facts in hand, here are concrete steps to apply the fruit chart to everyday meal planning and portion control.
How to Use the Fruit Chart for Healthy Meal Planning
Follow these stepwise instructions to use the fruit chart effectively for balanced meals, snacks and carbohydrate tracking. Each step includes practical tips and household equivalents so you can act immediately.
- Identify goals: Are you tracking calories, carbohydrates, or emphasizing micronutrients? Choose fruits that align with that goal (e.g., berries for low carbs, oranges for vitamin C).
- Use a reliable entry: Look up the fruit and serving size in the chart (or USDA FoodData Central) and note calories, carbs and fiber per your chosen measure (cup, medium piece, grams).
- Measure a real portion: Use a kitchen scale for accuracy (weigh in grams) or use household equivalents (one medium apple, 1 cup berries, 15–20 grapes). For grapes specifically, remember 1 cup ≈ 15–20 medium grapes (2025 USDA FoodData Central).
- Combine for balance: Pair fruit with protein or healthy fat to reduce glycemic impact and increase satiety (e.g., apple + 1 tbsp peanut butter; berries + ¾ cup Greek yogurt).
- Log and adjust: Track the portion and nutrient totals in your app or diary. If your daily carb target is 150 g, subtract the fruit carbs from that target and plan remaining meals accordingly.
- Swap mindfully: When craving sweetness, swapping dried fruit for fresh increases calorie density — choose fresh fruit for lower calories per volume. For details on dried vs raw differences, see the section below on drying effects.
- Seasonal and storage planning: For buying and storing recommendations when planning meals with seasonal fruit, check our seasonal guide: fall fruit seasonal guide.
Practical tips
- Pre-portion grapes into 1-cup snack bags to avoid overeating by hand-to-mouth nibbling.
- Keep cut fruit visible in the fridge for easy grab-and-go snacks; washed berries in a shallow container with paper towel last longer.
- If counting calories, remember avocado halves are calorie-dense — plan accordingly (1/2 avocado ≈ 160 kcal).
For meal planners focused on seasonal availability and recipes using fruit portions, see the suggested seasonal guide above and consider pairing fruit with proteins and whole grains for balanced meals.
Transition: Finally, let’s answer common reader questions about fruit servings, calories and measurement techniques.
Common FAQs About Fruit Serving Sizes and Nutrition
This section addresses frequent practical questions and common myths about fruit portions and nutrient impacts. Each FAQ gives a concise, evidence-based answer to help you make informed choices.
Transition: After the FAQs we’ll wrap up with a concise conclusion and next steps for readers who want deeper dives into selected topics.
Conclusion and Additional Resources
Key takeaways: a centralized fruit chart simplifies portion control and nutrient comparison — use cup measures, medium-piece standards, or a kitchen scale for accuracy. Fruits differ by calories, carbohydrates and micronutrient density; choose fruits based on your dietary goals and combine them with protein or healthy fats to improve satiety and glycemic response.
For broader context on growing your own produce, see spring vegetables growing guide which helps readers produce fresh fruits and vegetables at home.
Further reading and authoritative sources used in this guide: USDA FoodData Central (2025) for nutrient values; CDC for dietary guidance; Harvard T.H. Chan School of Public Health for evidence-based fruit and carbohydrate information. For targeted deep dives, check our sibling posts on fruit carbs, avocado nutrition and fruits & juice benefits.
Final call-to-action: Use the fruit chart above this week — weigh or cup your portions, track calories and carbs, and try swapping one processed snack for a portion of fruit each day to feel the benefits.
Frequently Asked Questions
What is a standard serving size of fruit according to nutrition guidelines?
A standard serving of fruit is typically 1 medium piece (e.g., an apple), 1 cup chopped or whole berries, or 1/2 cup dried fruit; these measures follow USDA FoodData Central conventions (2025) and are used on U.S. nutrition labels for consistent tracking.
How does the calorie content of fruit compare to other snacks?
Raw fruits usually have fewer calories per volume than many processed snacks because of high water and fiber content; e.g., 1 cup watermelon ≈ 46 kcal versus a 1-ounce bag of chips ≈ 150 kcal (2024 industry label averages).
How many grapes are in a typical serving of fruit?
A typical serving of grapes is 1 cup (about 151 g), which equals roughly 15–20 medium grapes and contains approximately 104 kcal (USDA FoodData Central, 2025).
How can I use a fruit chart to manage my daily carbohydrate intake?
Check the fruit’s carbs-per-serving in the chart, measure your portion (cup or grams), then subtract that carb amount from your daily target; combine fruit with protein or fat to slow glucose absorption (USDA FoodData Central-based values, 2025).
Does eating more fruit increase your calorie consumption significantly?
Eating additional servings increases calories proportionally; high-water fruits add fewer calories per cup, while calorie-dense fruits (avocado, banana) or dried fruits can raise daily calories more quickly (USDA FoodData Central comparisons, 2025).
How do I measure fruit portions accurately at home?
Use a kitchen scale for grams, measuring cups for chopped fruit, or standard pieces (one medium apple, 1 cup berries). Pre-portioning snacks into 1-cup bags helps maintain consistent servings.
Are raw fruits always lower in calories than dried fruits?
No. Dried fruits are calorie-concentrated since water is removed; 1/4 cup raisins contains substantially more calories than 1 cup of fresh grapes even though they originated from the same fruit (USDA FoodData Central, 2025).
How reliable are fruit nutrition facts from different sources?
USDA FoodData Central is the authoritative U.S. source for standardized nutrient data (2025); academic reviews and government guidance (CDC) complement those data. Values can still vary by variety, ripeness, and measurement method.