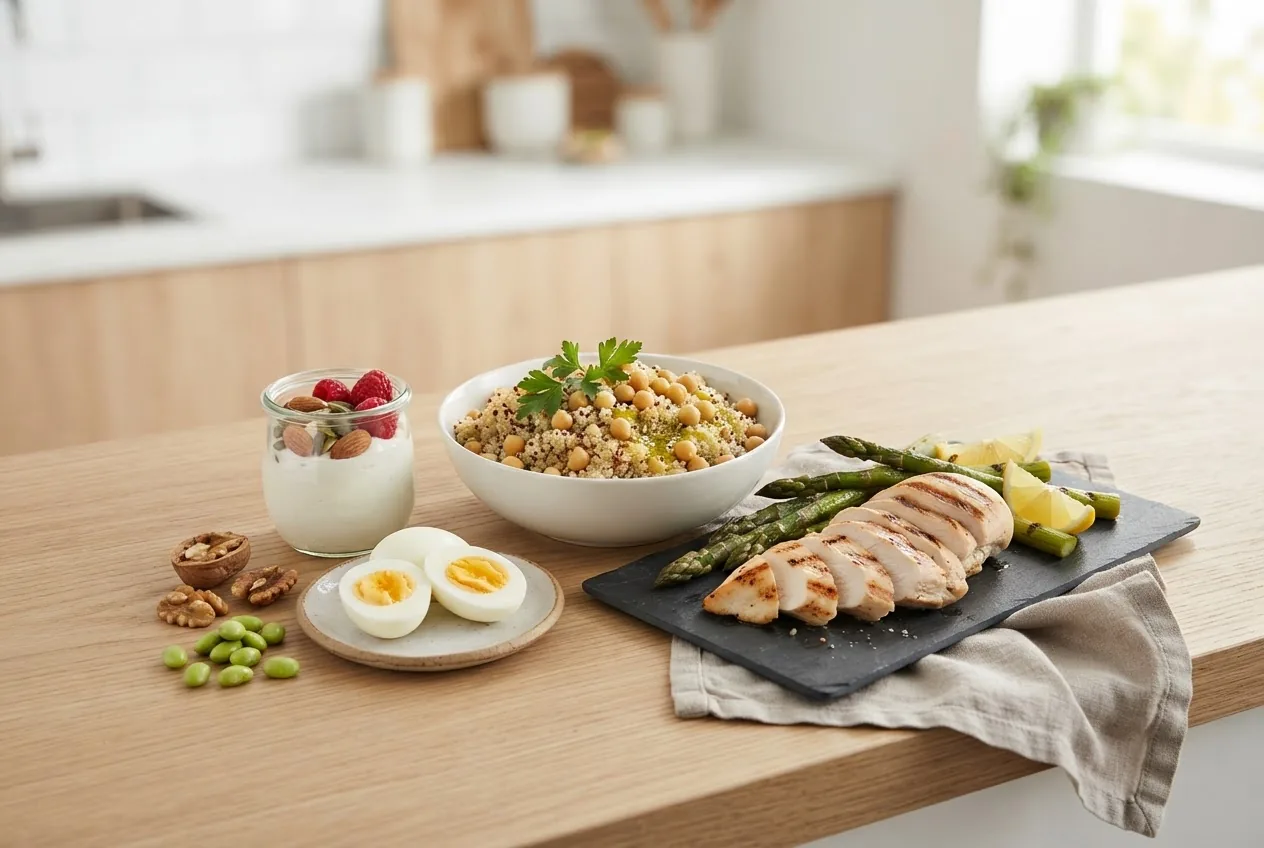
Highest protein foods chart: skinless chicken breast and many lean fish average ~31 g protein per 100 g, while cooked legumes typically supply 7–9 g per 100 g. According to 2023 USDA data, the most actionable benchmark for meal planning is protein per 100 g and protein per 100 kcal — we use both throughout this report.
Understanding Protein and Its Role in a Balanced Diet
Protein is a macronutrient and one of the three building blocks of food alongside carbohydrates and fats; it supplies amino acids essential for tissue repair, immune function and enzyme production. We describe measurable thresholds readers can use: grams per serving, grams per 100 g, and grams per 100 kcal — the latter helps compare protein density across foods.
Recommended intakes vary: the general U.S. Recommended Dietary Allowance (RDA) sets a baseline of 0.8 g/kg body weight for sedentary adults; active adults often require 1.2–2.0 g/kg. According to the NIH Office of Dietary Supplements, older adults and athletes commonly need more to preserve lean mass (government guidance).
Protein quality matters: animal proteins are typically complete (all essential amino acids) while many plant proteins are lower in one or more essential amino acids. We use “bioavailability” to mean how efficiently absorbed amino acids are used — animal sources generally score higher on common metrics.
For a broader context on how protein integrates into overall eating patterns see Balanced Nutrition Guide Explaining What a Balanced Diet Means and read about adequate intake for protein and nutrients, which defines intake standards and calculation basics.
Historical frameworks still useful: the Food Pyramid 1990 guidelines influenced serving-size thinking that survives in modern plate models.
Caveats and variability: food protein values vary with cut, cooking method and sample size. Where we present specific figures we use USDA FoodData Central values as a baseline and note variability where relevant. Always consult a registered dietitian or medical professional for individual medical conditions.
Key takeaway: Use grams per 100 g and grams per 100 kcal to compare protein density, then convert to familiar serving sizes for meal planning.
How to Read and Use a Highest Protein Foods Chart for Nutritional Planning
A practical chart must answer three questions: how much protein per serving, how many calories per serving, and how the food fits your goals (muscle gain, maintenance, weight loss). We lay out step-by-step procedures with examples and a short case walkthrough.
- Choose the comparison metric: grams per serving, grams per 100 g, or grams per 100 kcal. Use grams per 100 kcal to weight protein density against caloric budget.
- Match servings to your plate model: translate 100 g into common portions (e.g., 100 g chicken ≈ 3.5 oz cooked). For visual plate guidance, consult healthy plate protein portions.
- Factor in bioavailability and context: pair lower-quality plant proteins (rice, beans) to complete amino acid profiles across a meal, or rely on animal sources for single-meal completeness.
- Adjust for goals: for calorie-restricted weight loss prioritize high protein-per-calorie foods; for muscle gain, prioritize absolute protein per meal (20–40 g recommended post-workout in many protocols).
- Track and iterate: log meals for two weeks, assess satiety, energy and weight changes, then refine portions.
Example: you want 30 g protein at lunch and have 400 kcal allotted. Compare protein per 100 kcal values — skinless chicken (~7.8 g/100 kcal) and Greek yogurt (~6–7 g/100 kcal) deliver high density; starchy vegetables (~1–2 g/100 kcal) do not.
For structured macro splits and meal plans, see macro meal planning for protein.
To align chart use with portion visuals use healthy plate protein portions as a reference when sizing servings from the chart below.
Walkthrough (case): A 70 kg moderately active adult aiming for 1.4 g/kg needs 98 g protein/day. Splitting across three meals and two snacks gives ~25 g per meal. Using the chart, combine 120 g cooked chicken (≈37 g protein) with a 150 g mixed vegetable side (≈3–4 g) to hit target while leaving room for calories.
Key takeaway: Convert chart numbers into your target grams/day and plan portions that deliver consistent protein across meals for better muscle maintenance and satiety.
Comprehensive Highest Protein Foods Chart by Category
Below are reference comparison tables grouped by category with protein (g) per typical serving and calories per serving. Values reference USDA FoodData Central averages (we note source where specific rows draw directly from USDA). Use these for quick lookup and printable references.
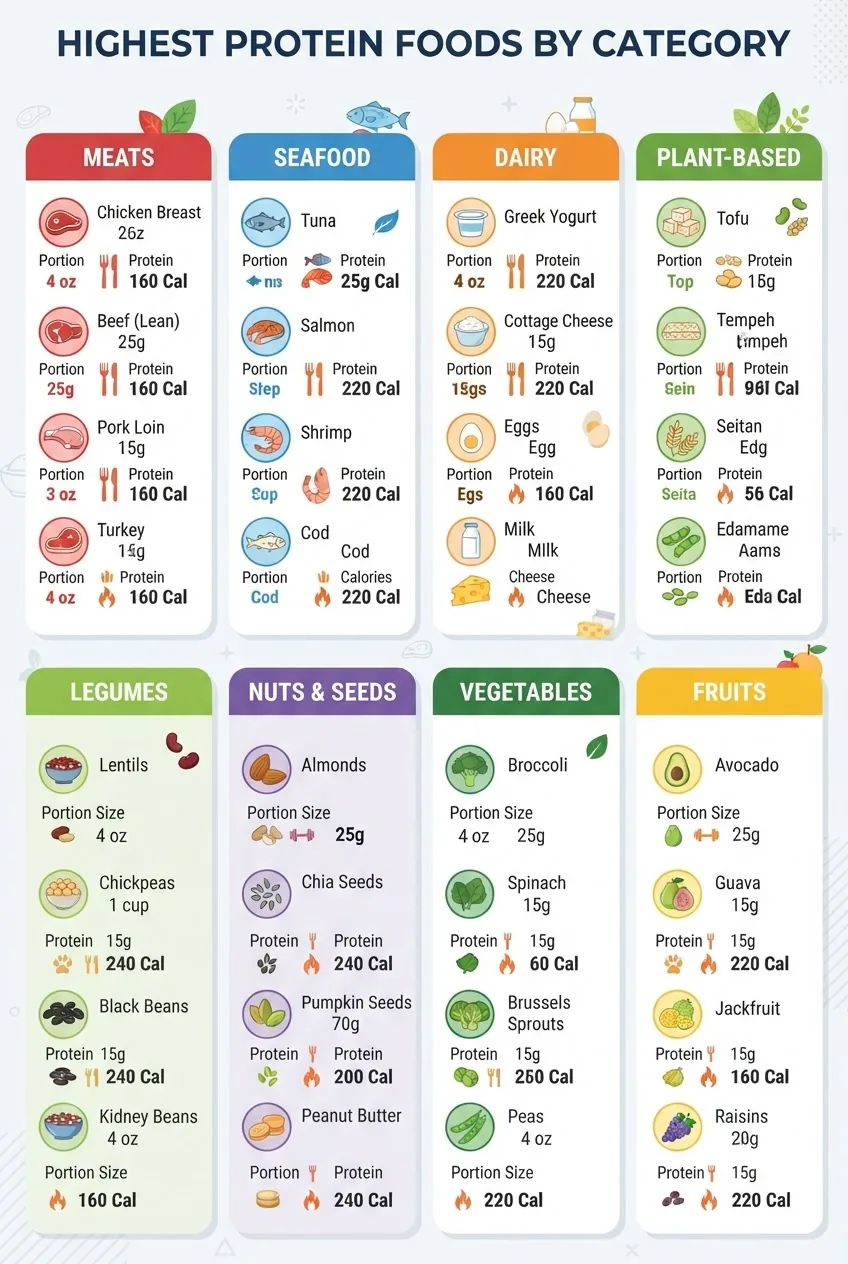
Meat & Poultry
| Food (cooked) | Serving | Protein (g) | Calories |
|---|---|---|---|
| Skinless chicken breast | 100 g | 31 | 165 |
| Turkey breast | 100 g | 29 | 135 |
| Lean beef (sirloin) | 100 g | 28 | 217 |
Seafood
| Food (cooked) | Serving | Protein (g) | Calories |
|---|---|---|---|
| Tuna (yellowfin) | 100 g | 30 | 132 |
| Salmon (Atlantic) | 100 g | 20 | 208 |
| Shrimp | 100 g | 24 | 99 |
Dairy & Eggs
| Food | Serving | Protein (g) | Calories |
|---|---|---|---|
| Greek yogurt (nonfat) | 170 g (6 oz) | 17 | 100 |
| Cottage cheese (low-fat) | 100 g | 11 | 98 |
| Large egg | 1 egg (50 g) | 6 | 72 |
Plant-Based & Legumes
| Food (cooked) | Serving | Protein (g) | Calories |
|---|---|---|---|
| Lentils | 100 g cooked | 9 | 116 |
| Chickpeas | 100 g cooked | 9 | 164 |
| Tofu (firm) | 100 g | 8 | 76 |
Nuts & Seeds
| Food | Serving | Protein (g) | Calories |
|---|---|---|---|
| Almonds | 28 g (1 oz) | 6 | 164 |
| Peanut butter | 2 tbsp (32 g) | 8 | 188 |
| Chia seeds | 28 g (1 oz) | 4 | 137 |
Vegetables & Fruits (not typically protein-dense)
| Food | Serving | Protein (g) | Calories |
|---|---|---|---|
| Broccoli (cooked) | 100 g | 2.8 | 55 |
| Spinach (cooked) | 100 g | 3 | 23 |
| Avocado | 100 g | 2 | 160 |
All table values are rounded and are intended as quick-reference averages; where specific analyses are required consult USDA FoodData Central (government nutrient database) for the exact entry used.
Key takeaway: Animal proteins often provide the largest absolute grams per serving; legumes and soy deliver competitive protein-per-calorie ratios for plant-focused diets.
Protein Content and Caloric Value: Balancing Your Intake
Protein and calories interact: foods high in protein can be high or low in calories depending on fat content. A useful metric for balancing is grams of protein per 100 kcal. We present thresholds to guide choices:
- High protein density: ≥6 g protein per 100 kcal (e.g., skinless poultry, many fish, low-fat dairy).
- Moderate density: 3–6 g/100 kcal (e.g., tofu, lean red meat depending on cut).
- Low density: <3 g/100 kcal (most fruits, starchy vegetables, oils, nuts may be lower because of fats).
Example comparisons: 100 g cooked chicken (31 g protein, 165 kcal) ≈ 18.8 g protein/100 kcal; 100 g almonds (21 g protein, 579 kcal) ≈ 3.6 g/100 kcal. That demonstrates why nuts, though protein-containing, are calorie-dense and require portion control for calorie-limited plans.
For strategies on balancing carbohydrate and protein intake see consistent carbohydrate diet principles and for energy-focused choices see energy-optimizing food choices.
Practical threshold: for a 1,600 kcal/day plan aiming for 25% of calories from protein → target protein calories = 400 kcal → protein grams ≈ 100 g (since protein = 4 kcal/g). Strategy: select 2–3 high-density protein servings (20–30 g each) and supplement with moderate plant proteins.
Key takeaway: Use protein-per-100-kcal to prioritize foods when you have a strict calorie target; use absolute grams per serving when calories are less constrained and the goal is building or preserving muscle.
Printable and Digital Protein and Calorie Chart Tools for Meal Planning
We provide templates and integration tips for printable charts and digital tools that use the data sets above. Two workflows: printable quick-reference and digital tracking with spreadsheet formulas or apps.
For visual examples and plate-based templates see visualizing healthy balanced meals.
Downloadable worksheets: use the printable nutrition worksheets and the weekly and daily meal planning templates to turn chart entries into meal plans.
How to create a printable protein-calorie chart: export the table rows above into a spreadsheet, add a column for “serving I use” and “frequency per week”, and print as a 2-column cheat sheet. For app integration, import USDA FoodData Central IDs into a tracking app supporting custom foods.
Key takeaway: Use printable charts for grocery shopping and a digital tool for longitudinal tracking and analytics (trends over weeks).
Common Questions About Protein Intake and Food Choices
Below are concise, evidence-focused answers to frequent questions about protein amounts and planning.
For micronutrient complements to protein-focused choices, consult our guide on vitamin content in protein-rich foods.
Methodology — How we assessed this
We compiled averages from the USDA FoodData Central database, cross-checked protein densities against recent nutrition reviews, and standardized servings to common household measures. We prioritized whole-food entries and used per-100 g and per-serving metrics to create comparable tables. Variability is reported where notable.
Key takeaway: The tables reflect standardized USDA averages; individual food items can differ by supplier, processing, and cooking method.
Tips for Incorporating High-Protein Foods into a Balanced Diet in Texas
Texas has abundant access to grilled and smoked lean proteins plus strong traditions of legumes and corn — a combination well-suited to higher-protein, balanced plates. Focus on local availability and seasonality to keep costs low and freshness high.
Practical culturally relevant swaps: replace a high-fat brisket portion with grilled chicken or fish in mixed plates, add black beans and grilled corn for fiber and added protein, and use Greek yogurt dressings rather than sour cream to increase protein density in Tex-Mex dishes.
If your goal is calorie-controlled weight loss, consider the 1200 calorie meal plan for balanced weight loss as an application of the protein-per-calorie chart; for slightly higher energy needs see the 1400 calorie meal plan for healthy balanced diet.
If you favour Mediterranean-style eating, integrate local seafood and legumes; see our Mediterranean list for alternatives: Mediterranean diet protein sources.
Shopping tips for Texas markets: buy whole chickens and portion at home for cost-per-protein efficiency; buy canned tuna or salmon on sale; prioritize dried beans or frozen legumes for shelf-stable, high-protein plant options.
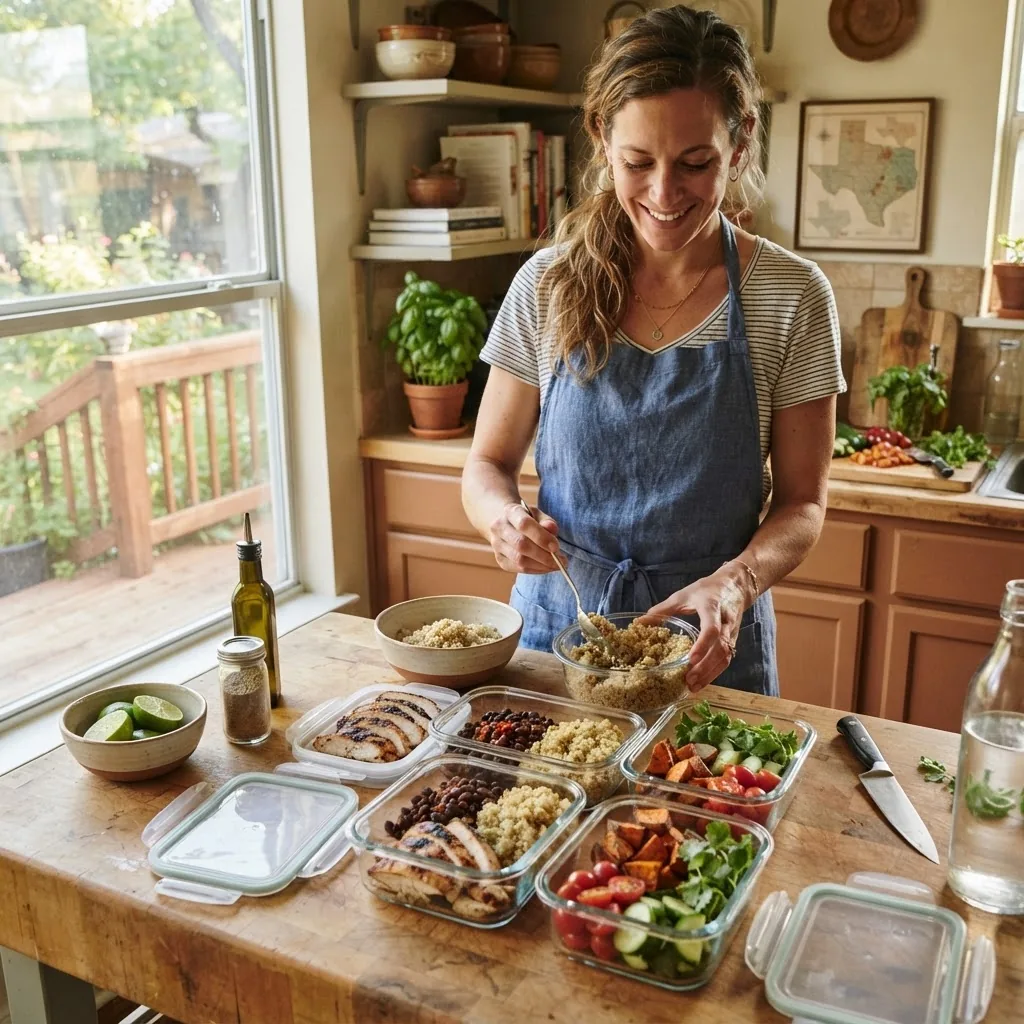
Meal prep pattern: prepare a 3-day batch of a protein base (grilled chicken or roasted chickpeas), portion into labelled containers with vegetables and a whole grain. Rotate sauces and spices (e.g., Southwest spice mix, lime, cilantro) to keep meals appealing.
Key takeaway: Local culture and seasonality can help you adopt high-protein meals that remain affordable and varied; swap higher-fat cuts for leaner proteins and add legumes to boost plant-based protein intake.
What the numbers mean for you
- Target a minimum of 20–30 g protein per main meal — use the chart to pick combinations that reach this without blowing your calorie budget.
- Prioritize foods ≥6 g protein per 100 kcal when on strict calorie targets; prioritize absolute grams per serving when your goal is muscle gain.
- Combine plant proteins across meals (e.g., grains + legumes) to achieve complete amino acid profiles if avoiding animal products.
- Use printable charts for grocery runs and a digital tracker for weekly protein totals and trend analysis.
- Consult registered dietitians for age-specific and medical-condition-adapted protein goals; governmental resources (NIH, USDA) provide baseline guidance.
Practical example: For an adult aiming for 100 g/day, two 30–35 g protein meals (e.g., 140 g cooked chicken + 1 cup lentils across a day) plus protein snacks (Greek yogurt or cottage cheese) will meet the goal with balanced calories.
Closing summary: the most actionable metric is protein per 100 kcal combined with absolute grams per serving. Use the tables, printable worksheets and plate model links to convert data into daily habits.
External authority sources cited: USDA FoodData Central for nutrient data, Academy of Nutrition and Dietetics for professional guidance, and NIH Office of Dietary Supplements for intake frameworks.
If you want a printable quick-reference derived from these tables, export the “Food, Serving, Protein, Calories” columns into a two-column PDF and laminate for kitchen use. That is the fastest way to turn this chart into behavior change.
Final takeaway: Measure protein by both density and absolute grams, convert to familiar portions, and use consistent tracking to reach your daily target.
Call to action: download the printable worksheet linked above and map one week’s meals to your protein targets, then iterate based on satiety and performance.