
food pyramid 1990: The 1990 USDA Food Guide Pyramid organized foods into layered groups to guide daily servings, emphasizing grains at the base and fats/sugars at the top; it shaped school nutrition, household meal planning, and early weight-loss guidance though later revised for clarity and updated science.
Introduction to the Food Pyramid 1990
Answer: The 1990 USDA Food Guide Pyramid was an official government nutrition graphic introduced to show recommended daily servings across food groups and to provide a simple foundation for meal planning and nutrition education nationwide.
Term: serving — a serving is a standardized amount of food used to estimate nutrient and caloric intake for guidance and comparison.
The USDA nutrition guide released in 1992 and widely referenced as the 1990 Food Guide Pyramid summarized decades of policy development and research into a single visual hierarchy: larger blocks for foods recommended in greater amounts (grains, fruits, vegetables), smaller blocks for dairy and protein, and a narrow peak for fats, oils and sweets. The pyramid aimed to translate dietary science into everyday choices for adults, children and institutions.
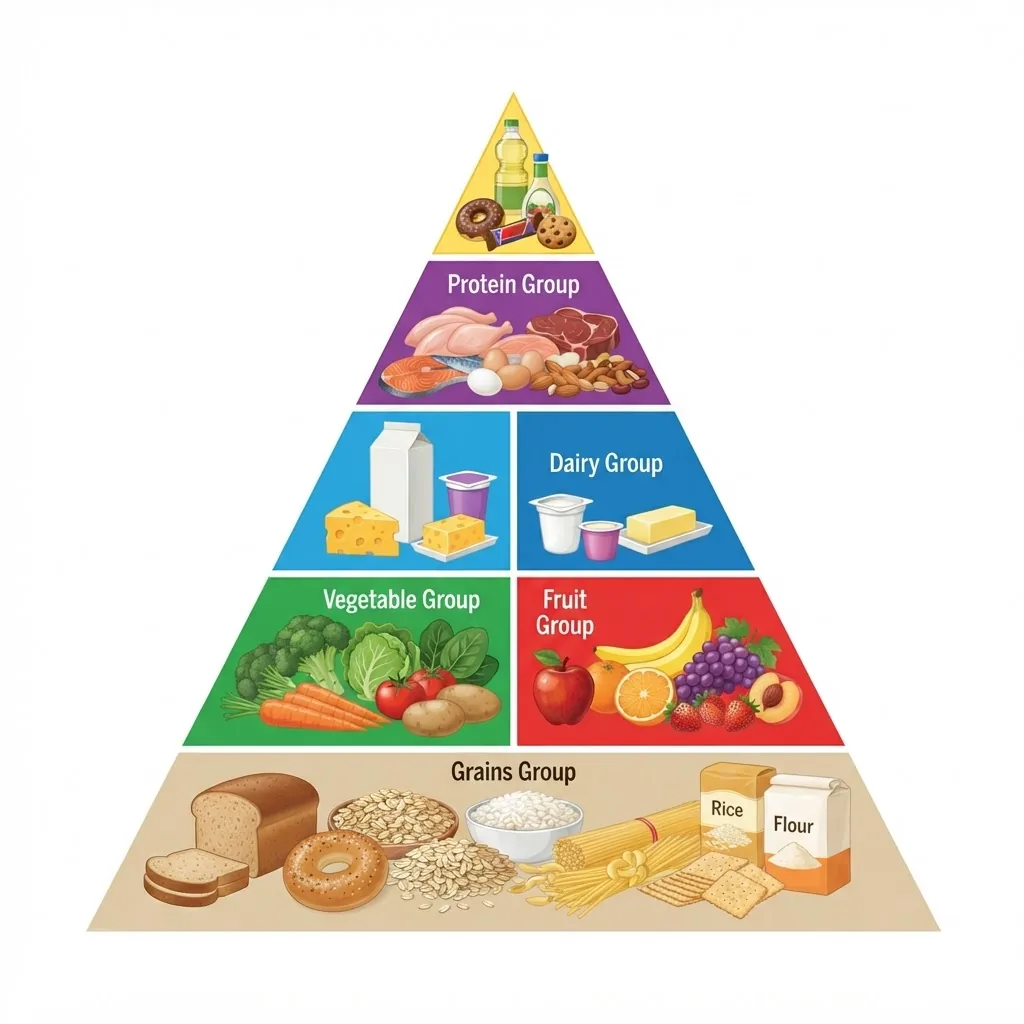
Historically, the pyramid helped schools and public campaigns standardize messaging—especially across states like Texas where school lunch programs and county health departments adapted the graphic into curricula and posters used in the 1990s and early 2000s. According to a 1994 USDA educational report, the pyramid was distributed widely to state agencies and schools as a core teaching tool (government publication).
Structure and Components of the Food Pyramid 1990
Answer: The pyramid arranged six primary food groups into layers with recommended daily serving ranges: grains (base), fruits and vegetables, dairy and protein above them, and fats/sweets at the top, with serving-size guidance to translate the tiers to meals.
Term: refined grains — grains processed to remove bran and germ, often lower in fiber and micronutrients compared with whole grains.
- Grains (6–11 servings/day): The base of the pyramid emphasized breads, cereals, rice and pasta as primary energy sources and the foundation of daily intake.
- Vegetables (3–5 servings/day): Recommended next for vitamins, minerals and fiber, the pyramid grouped starchy and non-starchy vegetables together.
- Fruits (2–4 servings/day): Fresh, canned or frozen fruits were promoted as important for vitamins and fiber.
- Dairy (2–3 servings/day): Milk, yogurt and cheese provided calcium and protein; the pyramid recommended low-fat options in guidance text.
- Protein (2–3 servings/day): Meat, poultry, fish, dry beans, eggs and nuts were grouped for protein and iron; the pyramid allowed plant and animal sources.
- Fats, oils and sweets (use sparingly): Placed at the apex to indicate limited consumption due to high caloric density and low nutrient value.
The pyramid used serving ranges rather than absolute portions to accommodate different calorie needs across ages and activity levels. For example, a single grain serving was typically defined as one slice of bread, 1/2 cup cooked rice or pasta, or 1 ounce dry cereal; a dairy serving equaled 1 cup of milk or yogurt or 1½ ounces of natural cheese. When discussing serving quantities, see adequate intake definitions for formalized nutrient recommendations.
Practical translation to plates: a recommended adult with moderate activity might aim for 6–8 servings grains, 3–4 vegetables, 2–3 fruits, 2 dairy, and 2 protein servings daily, adjusting for calories. The pyramid text acknowledged that “servings” are scaled by energy requirement and recommended nutrient-dense choices within each group. For carbohydrate-focused planning, consult consistent carbohydrate diet guidelines.
Methodology: USDA recommendations were based on nutrient adequacy and population-level intake surveys; the pyramid prioritized energy-providing foods first, then nutrient-dense groups to fill micronutrient needs. According to a 1990 USDA technical summary (government report), the visual prioritized practicality for institutions and broad public campaigns.
The Food Pyramid 1990’s Role in Healthy Eating Plans
Answer: The 1990 pyramid served as a practical framework for balanced nutrition, guiding meal planning by translating food groups into daily servings and influencing school menus, family meal patterns, and nutrition education programs.
As a foundation for a balanced nutrition guide, the pyramid encouraged variety across food groups rather than single-food dieting, supporting nutrient adequacy when users followed the serving guidance.
Examples (practical application):
- Family breakfast: 1 slice whole-grain toast + 1 cup milk + 1 small banana = 1 grain, 1 dairy, 1 fruit serving.
- School lunch adaptation in Texas: rotating menus used 1 grain roll, ½ cup vegetables, ½ cup fruit, lean protein and 1 cup milk to meet federal meal standards aligned with the pyramid (state school nutrition report, state education archive).
- Meal pattern for a 1,800 kcal adult: 6 grain servings (preferably whole grains), 4 veg, 3 fruit, 2 dairy, 2 protein, minimal fats/added sugars.
For visual learners, the pyramid linked easily to meal planning worksheets and plate-building exercises; for printable visuals see visual guides to balanced diets.
Nutrition education in schools used the pyramid to teach the six classes of nutrients and meal composition; county health departments often paired lessons with garden and cooking activities to reinforce choices. According to a 1996 USDA education program evaluation (government report), school adoption improved students’ awareness of food groups and increased fruit-and-vegetable exposure in cafeterias (government publication).
Balancing energy and nutrients: the pyramid’s emphasis on grains as a base reflected calorie needs; to maximize nutrient density and energy management, planners were encouraged to choose whole grains, lean proteins and low-fat dairy, as explained in resources on maximizing energy through diet.
Tools to apply the pyramid to daily life included nutrition planning worksheets for families and educators.
For deeper definition of balanced diet principles originated from the pyramid, read more on what balanced nutrition means.
Food Pyramid for Kids – Suitability and Adaptations
Answer: The 1990 pyramid can guide children’s meals when serving ranges are adjusted for age, activity, and growth needs; schools and parents adapted portions and emphasized whole foods while limiting fats and sweets.

Parents and school nutritionists used the pyramid as a teaching scaffold but modified recommended servings downward for younger children and upward for active teens. Practical adaptations include:
- Portion scaling: Younger children often need half to two-thirds of adult servings; use measuring cups and visual cues (fist-sized portions for grains/protein) and consult age-based guidance in government resources (state school nutrition guidelines).
- Frequent small meals: Younger kids benefit from consistent small meals and snacks incorporating fruits/veggies to meet total daily servings without large portions.
- Emphasis on whole grains and low-fat dairy: Swap refined cereals for whole-grain options and choose lower-fat dairy to reduce saturated fat while preserving calcium.
- Limit sweets and sugary beverages: Replace sodas with water or milk and offer fruit-based desserts to lower added-sugar exposure.
- Hands-on education: Gardening and cooking in schools provide practical experience aligning with pyramid groups and nutrition curricula; a 1998 state education program report found hands-on lessons improved fruit and vegetable intake at school meals (state program evaluation).
When planning meals, parents should map out daily servings across meals and snacks; a simple daily checklist adapted for children can help track goal servings and ensure variety. For printable and classroom-friendly templates, see nutrition planning worksheets.
Safety and growth: pediatric needs vary—iron-rich proteins and dairy for bone growth are critical; if reducing calorie density for weight concerns, prioritize nutrient-rich choices to support development. According to pediatric nutrition literature (peer-reviewed journal), restrictive diets for children require professional oversight to avoid nutrient gaps (peer-reviewed source).
Critiques and Limitations of the Food Pyramid 1990
Answer: Critics argued the 1990 pyramid overemphasized grains, treated all fats similarly, and did not distinguish whole versus refined grains clearly, contributing to confusion around sugar and fat consumption and prompting calls for revision.
Key criticisms included:
- Grain-dominant message: By placing grains at the base, the pyramid was seen as implicitly endorsing high carbohydrate intake without clarifying whole versus refined grain quality; critics linked this to rising refined-carbohydrate consumption in the U.S. diet (nutrition critique, peer-reviewed commentary).
- Fats grouped together: The pyramid did not differentiate saturated, unsaturated and trans fats clearly in the visual, which many nutritionists argued led to misunderstanding about healthy fats (journal article critique).
- Added sugars and oils: Grouping fats and sweets at the apex did not communicate sufficiently that moderate healthy oils (e.g., olive oil) are beneficial while added sugars are not; nuance was missing for consumer decision-making.
- Lack of portion clarity for variable energy needs: Serving ranges were broad, leaving consumers uncertain how to adjust for calories, activity or weight goals without additional guidance.
- Insufficient emphasis on food quality: Nutrient density, food processing and added sugars were not highlighted strongly, which subsequent evidence-based guidelines emphasized more (2020 Dietary Guidelines Advisory Committee report, government committee publication).
Scientific developments since 1990 changed the context: evidence emerged differentiating carbohydrate types, clarifying the benefits of unsaturated fats, and linking added sugars and ultra-processed foods with cardiometabolic risks. According to a 2016 peer-reviewed review (journal article), dietary guideline visuals needed to evolve to reflect those distinctions (peer-reviewed source).
Policy and political critique: Some researchers and public health advocates noted that agricultural production interests shaped group prominence, a contention explored in policy literature (academic analysis). These critiques drove revisions culminating in plate-based and other models that emphasize proportion and food quality as much as quantity.
What Replaced the Food Pyramid? Overview of Modern Nutrition Models
Answer: The Food Pyramid 1990 was succeeded by updated pyramids and ultimately by the MyPlate model in 2011, which emphasizes proportional plate composition and clearer guidance on portioning and food quality.
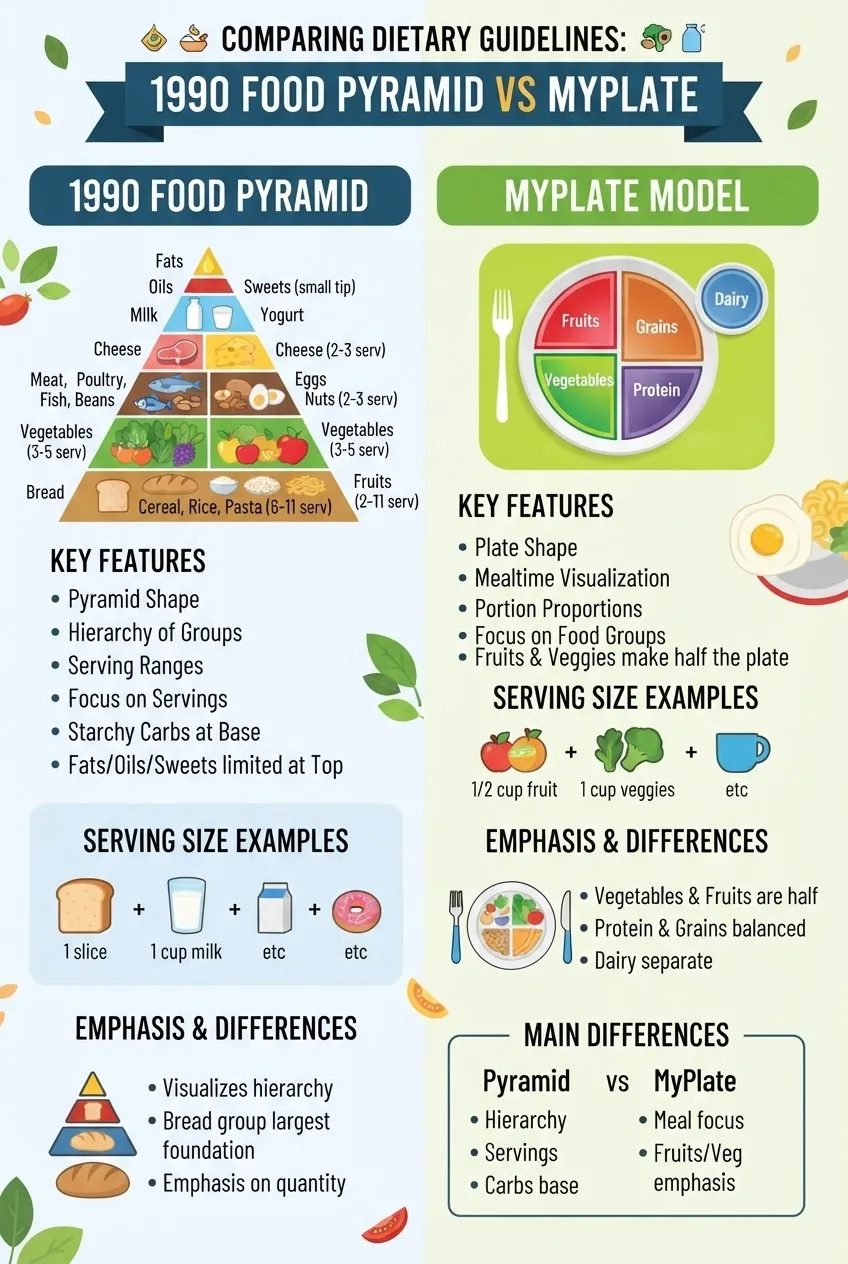
| Aspect | 1990 Food Pyramid | MyPlate (2011 onwards) |
|---|---|---|
| Visual format | Vertical layers indicating quantity by tier. | Plate divided into portions for each group for a single meal. |
| Focus | Servings per day across groups. | Proportion of a single meal and food quality emphasis. |
| Clarity on fats/sweets | Grouped narrowly at the top with “use sparingly” note. | Emphasizes healthy oils and reducing added sugars via text guidance. |
| Actionability | Required additional materials for portioning. | Easier to apply at meal time; paired with online resources. |
| Underlying basis | Population-level nutrient adequacy and food group servings (1990s evidence). | Updated evidence emphasizing dietary patterns, food quality and chronic disease risk (2010s guidance). |
The transition to MyPlate (launched by USDA in 2011) moved the public messaging from daily serving ranges to meal-portion visuals, reflecting critiques of the pyramid and newer science highlighted by advisory committees. For a detailed account of the transition and how plate and pyramid models compare, see food pyramid and healthy plate model.
Authoritative resources: the USDA and CDC provide current guidance on MyPlate and dietary patterns—see the USDA historic summaries and MyPlate pages for government context and the CDC for nutrition strategy and public health data: USDA food and nutrition, CDC nutrition.
Evidence base: ongoing peer-reviewed analyses explain the scientific rationale for shifting from servings-based visuals to pattern-focused models; for example, a comprehensive review of dietary guidance history (peer-reviewed) summarizes why visuals evolved (peer-reviewed journal). Key review on dietary guidance history.
Using Diet Pyramid Approaches to Lose Weight – Insights and Effectiveness
Answer: Diet pyramid approaches can support weight loss when converted into energy-controlled meal plans emphasizing nutrient-dense choices, portion control, and reduced added sugars and refined carbohydrates; success depends on caloric balance and behavior change.
Principles for weight loss using pyramid-based ideas:
- Translate servings to calories: Convert pyramid servings into a daily calorie target based on age, sex and activity, then distribute servings across meals.
- Prioritize whole grains and vegetables: Swap refined grains for whole to increase satiety and fiber intake while maintaining grain servings.
- Control portions of energy-dense foods: Use the pyramid’s top tier (fats/sweets) as a cue to restrict consumption and prefer healthy fats in moderation.
- Track and adjust: Monitor weight and energy levels and modify serving counts or food choices to ensure steady weight loss (0.5–1.0 lb per week typical guidance from clinical recommendations).
- Behavioral supports: Meal planning, grocery lists, and routine meals reduce impulsive high-calorie choices and help adhere to the pyramid framework.
Numbered tips for effective calorie-controlled pyramid use:
- Estimate your calorie need: Use a validated calculator or consult a registered dietitian to set a calorie target.
- Map servings to target calories: Allocate grain, protein and dairy servings within the calorie budget—choose lower-calorie options where possible.
- Increase non-starchy vegetables: Fill plates with vegetables to increase volume without many calories.
- Replace sugary drinks: Swap sodas and juices for water or unsweetened tea to cut added sugars.
- Weigh/measure initially: Learn portion sizes to better translate pyramid servings into real plates, then move to visual cues.
- Monitor progress weekly: Adjust calories and servings based on weight trends and satiety cues under guidance if needed.
Practical calorie frameworks aligned with pyramid principles are available for those needing structured plans. For example, see our guides for balanced weight loss meal plans and healthy 1400 calorie diet plans as starting templates that translate pyramid servings into calorie targets.
Evidence and caution: While pyramid frameworks can organize food choices, weight loss requires a caloric deficit. According to a 2019 systematic review (peer-reviewed journal), dietary pattern frameworks that emphasize whole foods, lower added sugars, and portion control produce sustainable weight loss when combined with behavior change strategies (peer-reviewed source).
Tip: For those using pyramid concepts for weight loss, track macronutrient balance implicitly (adequate protein to preserve lean mass) and emphasize fiber-rich foods for satiety; see our portion and macro resources for practical applications: portion and serving size guidance and macro planning.
Legacy and Relevance of the Food Pyramid 1990 in Today’s Nutrition Education
Answer: The Food Pyramid 1990 left a durable legacy by introducing a single, easy-to-understand nutrition visual that shaped decades of public health campaigns and education, even as newer models refined its messaging around food quality and portion proportions.
The pyramid’s historical impact includes:
- Standardizing nutrition curricula across schools and public health programs in the 1990s and early 2000s.
- Providing a base model for later visuals (pyramids, plates and pyramids with activity components).
- Highlighting the need for clearer communication on food quality, which directly influenced MyPlate’s adoption and subsequent educational tools.
In Texas and elsewhere, county health educators still reference the pyramid when teaching food groups, using its simple grouping as a stepping-stone to more nuanced current guidance emphasizing dietary patterns and nutrient density. According to a 2005 public health education review (government/academic report), legacy visuals remain useful for introducing concepts before transitioning learners to pattern-based guidance (government/academic publication).
Looking forward, the pyramid’s role is primarily historical and pedagogical: it shaped nutrition literacy and public health messaging strategies and serves as a reference point when evaluating how communication shapes dietary behavior.
Conclusion: The Food Pyramid 1990 provided a foundational, easy-to-use visual for translating nutrition science into daily choices for families, schools and institutions. While its emphasis and clarity had limitations—especially around fats, refined grains and portion scaling—its legacy persists in modern guidance that prioritizes food quality and proportional plate-building. For hands-on planning and calorie-specific meal templates that convert pyramid servings into practical weight-loss or family meal plans, explore our balanced weight loss meal plans and healthy 1400 calorie diet plans, or consult a registered dietitian for personalized guidance.