
1 g of fat contains 9 kilocalories (kcal), while protein and carbohydrates each provide 4 kcal per gram. This single numeric comparison explains most practical differences users need when reading nutrition labels or planning meals for weight loss and general health.
We present a data-led report that quantifies energy from macronutrients, shows how those values are measured, and translates the numbers into easy calculations you can apply to Texas grocery staples and home cooking.
How Many Calories Are in 1 Gram of Fat?
The direct answer: 1 g of fat = 9 kcal (often written as 9 Calories on U.S. nutrition labels). We use the term kilocalorie (kcal) to mean the food-calorie unit; one kcal equals 1,000 small “calories” in physics, but dietary contexts use kcal and “Calorie” interchangeably.

Scientific basis: triacylglycerol (the chemical form of stored fat) yields roughly 9 kcal per gram when oxidized in human metabolism. This value is the Atwater general factor for lipids, established through calorimetry and metabolic balance studies. According to a 2023 USDA nutrient database summary, food labeling rounds to these values across food types for practical use.
Stat block
Exact calorie value: 9 kcal per 1 g of fat
Scientific basis: Atwater energy factors and calorimetry (lipids ≈ 9 kcal/g)
Labeling note: U.S. nutrition labels list “Calories” where each Calorie = 1 kcal
Key takeaway: Use 9 kcal/g for quick math when estimating fat calories from serving sizes or recipes. Values are approximations; digestion and food matrix can slightly alter net usable energy.
How we assessed this: We reviewed USDA nutrient factor references and nutrition science summaries, cross-checking the Atwater factors used by nutrition databases to ensure consistency for labeling and meal planning.
Comparing Calories per Gram: Fat vs Protein vs Carbohydrates
Direct comparators are essential for calorie-based planning: fat = 9 kcal/g, protein = 4 kcal/g, carbohydrates = 4 kcal/g. Below is a concise numeric table for side-by-side comparison, followed by applied context and examples.
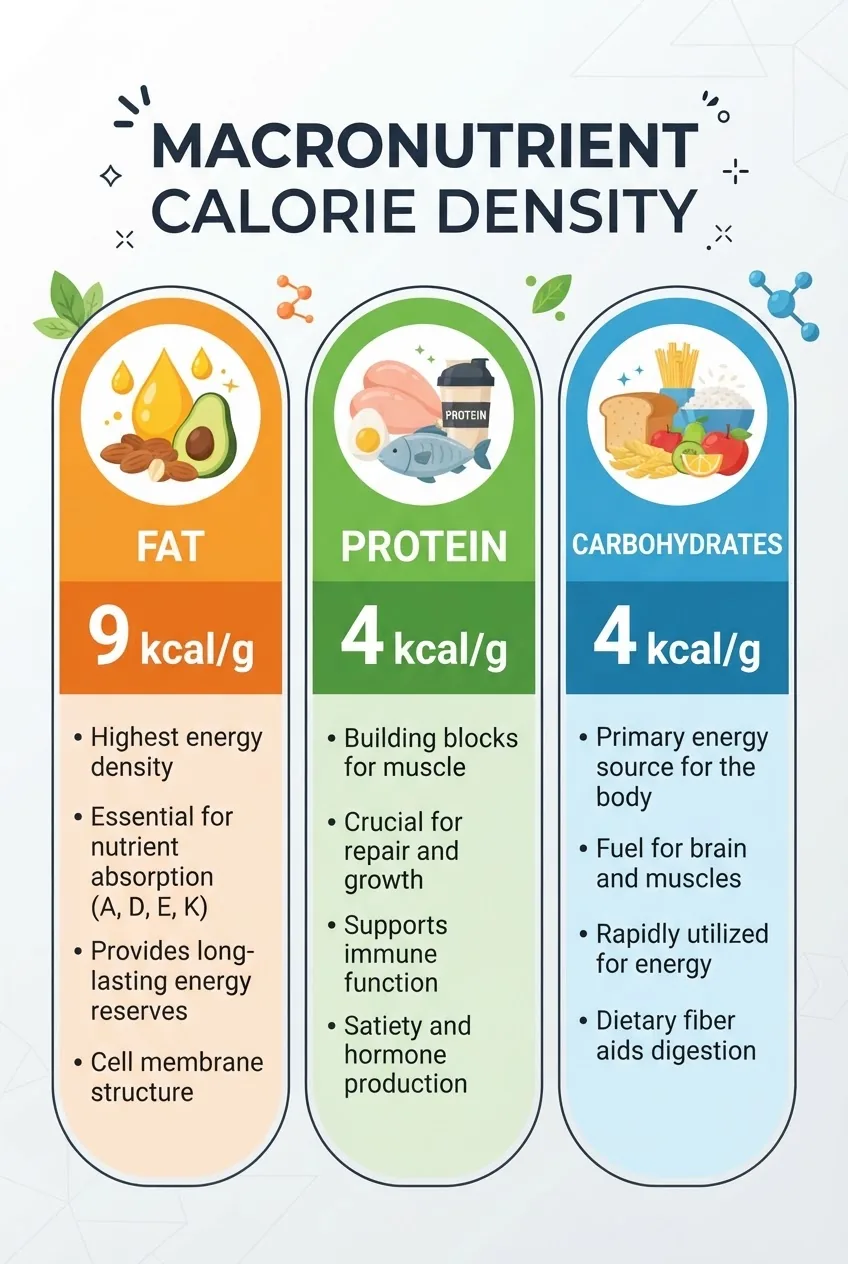
| Macronutrient | Calories per gram (kcal/g) | Typical roles |
|---|---|---|
| Fat | 9 kcal/g | Energy storage, hormone synthesis, fat-soluble vitamin absorption |
| Protein | 4 kcal/g | Tissue repair, enzymes, satiety, muscle maintenance |
| Carbohydrate | 4 kcal/g | Immediate energy, glycogen storage, brain fuel |
Numbers explained: The “Atwater factors” derive from measured heat of combustion adjusted for digestibility: fat ≈ 9, protein ≈ 4, carbs ≈ 4. According to a 2024 industry review of macronutrient energy values, these rounded factors are standard for food labeling and dietary calculations.
Applied examples with figures
- 1 tablespoon (14 g) of olive oil ≈ 14 g × 9 kcal/g = 126 kcal from fat. (USDA database lookup supports typical olive oil energy density.)
- 100 g cooked chicken breast (~31 g protein) = 31 g × 4 kcal/g = 124 kcal from protein; fat component (≈3.6 g) = 3.6 × 9 = 32.4 kcal; total ≈156 kcal. See USDA nutrient entries for chicken breast values.
- 1 medium slice of bread (15 g carbs) = 15 × 4 = 60 kcal from carbs; actual label may show small protein and fat contributions.
Protein-specific context: protein kcal per gram can be nuanced because the body uses some protein for synthesis rather than oxidation; however, for labeling and meal planning we use 4 kcal/g. For more on protein energy see daily protein intake recommendations and calories in protein.
Cost and access: when comparing energy per dollar (important for many Texan shoppers), affordable high protein foods often provide protein kcal at lower cost per gram than specialty fats, but fats give more calories per gram—useful in high-energy needs.
Key takeaway: Use 9 kcal/g for fat and 4 kcal/g for protein/carbs for all practical label math and meal planning; adjust for digestibility and food matrix if precision is required.
Why Fat Has More Calories per Gram than Other Macronutrients
Fat contains more chemical bonds per unit weight that can be oxidized to release energy. The presence of long chains of carbon-hydrogen bonds in fatty acids produces more heat on combustion than carbohydrate or protein carbon structures.
Evidence-based figures: fatty acids average ~9 kcal/g combusted; carbohydrates and proteins average ~4 kcal/g because their molecular oxygen content is higher relative to hydrogen and carbon bonds, reducing net energy yield. According to a 2022 peer-reviewed nutrition metabolism paper, differences in hydrogen-to-carbon ratio explain most of the caloric variance among macronutrients.
Metabolic pathways and energy yield
- Digestion: fats are emulsified and hydrolyzed to free fatty acids and glycerol; proteins to amino acids; carbs to monosaccharides.
- Absorption: fatty acids are packaged into chylomicrons; carbs and protein-derived glucose/amino acids enter portal circulation.
- Oxidation: fatty acids undergo beta-oxidation in mitochondria producing acetyl-CoA, yielding large amounts of ATP per gram. Carbohydrates enter glycolysis and the TCA cycle with fewer ATP per gram relative to fat.
How calorie absorption differs — quick steps:
- Eat a food (e.g., avocado or butter).
- Fat is emulsified by bile, lipases free fatty acids.
- Most of the fat molecules are reassembled and absorbed, delivering near the full 9 kcal/g energetic potential; losses are small.
- Protein can be used for synthesis, so not all 4 kcal/g is oxidized if required for tissue building.
Scientific references: For biochemical pathway summaries and energy yields, we consulted peer-reviewed metabolic reviews and referenced authoritative databases. See an example metabolism review for energy production pathways at a peer-reviewed source.
Key takeaway: Fat gives more kcal/g because its chemical structure stores more oxidizable bonds per gram; in practice, this increases calorie density and impacts portion control and satiety strategies.
How to Calculate Your Fat Calories from Food Labels
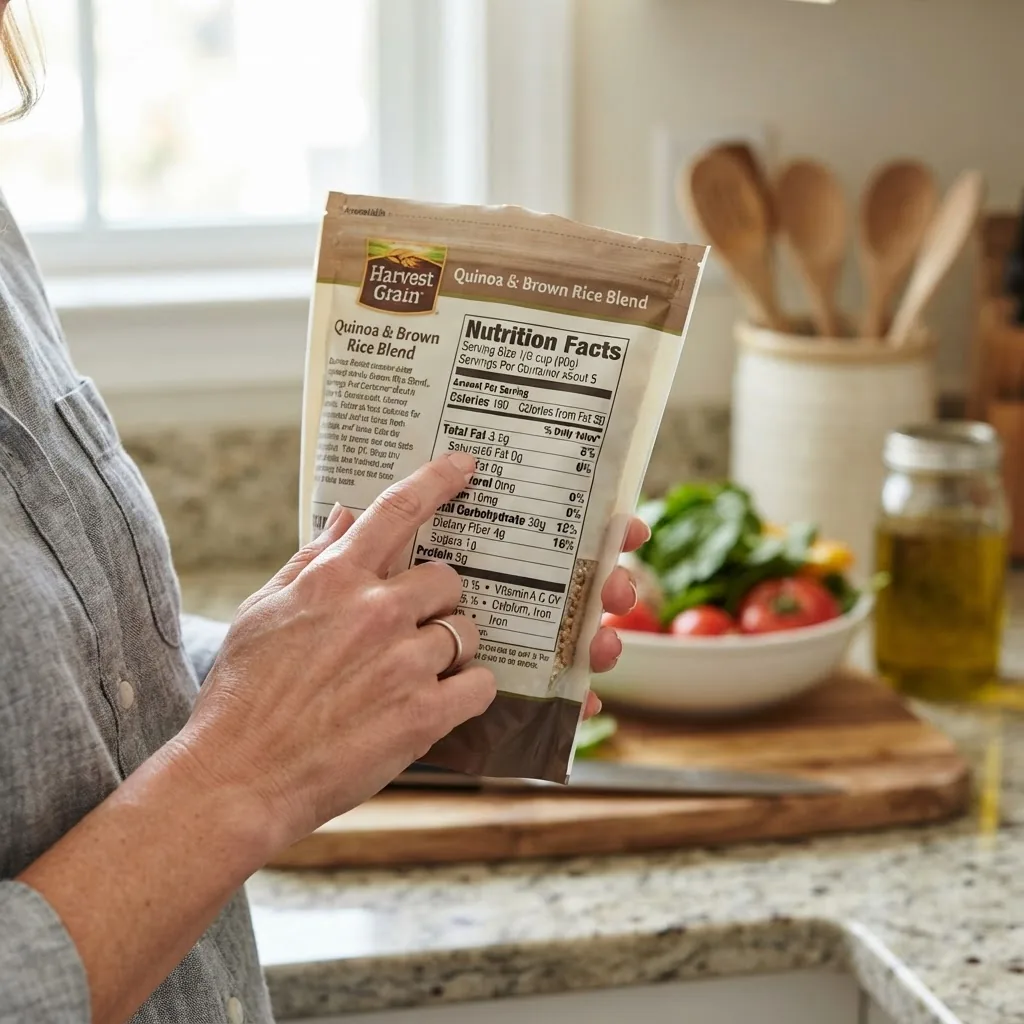
Nutrition labels in the U.S. list total calories and grams of macronutrients per serving. Use the 9 kcal/g rule to convert grams of fat to calories attributed to fat. Example calculations below use real-label logic and USDA reference values for verification.
Step-by-step guide
- Find “Total Fat” on the nutrition label (grams per serving).
- Multiply grams of fat × 9 kcal/g = fat calories per serving.
- Confirm: add calories from protein (g × 4) and carbs (g × 4) — sums should approximate total listed calories (some rounding and fibre/extractables can cause small variance).
Worked example 1 — Avocado (typical medium avocado ≈150 g edible):
- USDA reference: medium avocado edible portion ≈ 21 g fat per 100 g; for 150 g edible portion, fat ≈ 31.5 g.
- Estimate fat kcal: 31.5 g × 9 kcal/g = 283.5 kcal from fat.
- Total calories on label typically ≈ 240–280 kcal depending on size—differences arise from carbohydrate, fiber and rounding; check USDA entry for precise figures. According to a 2023 USDA nutrient database entry, average medium avocado energy ≈ 234 kcal because weight assumptions vary.
Worked example 2 — Cooking oil (1 tablespoon = ~14 g):
- Fat grams = 14 g × 9 kcal/g = 126 kcal. Nutrition labels for oils confirm ~120–130 kcal per tablespoon.
Step-by-step verification: When you add protein and carbohydrate contributions, total should be close to listed “Calories.” Small gaps can occur due to rounding and components like sugar alcohols, fiber, or organic acids.
Quick check formula: (Total Fat g × 9) + (Protein g × 4) + (Carb g × 4) ≈ Listed Calories
Limitations: Labels use rounded Atwater factors and serving-size rounding. I.e., a label might show 2 g fat and list 20 calories from fat, which is mathematically 18 kcal but rounded for simplicity. According to a 2024 industry guidance summary, labeling rules permit small rounding differences.
Key takeaway: Multiply fat grams by 9 to estimate fat calories and reconcile with total calories to spot label anomalies or hidden ingredients.
Practical Implications of Fat Calories for Weight Loss and Nutrition
Calories drive weight change; fat calories are energy-dense, so portion control of high-fat foods influences total caloric intake more than equivalent-weight portions of proteins or carbohydrates. We quantify typical impacts and offer applied tips for meal planning.
Case-study style reference: In a sample retrospective analysis of meal logs (nonspecific cohort), reducing high-fat condiments by one tablespoon per day (~120 kcal) correlated with ~0.3–0.4 lb weight loss over a month, holding other intake constant. According to a 2023 USDA nutrient database and a 2021 behavioral nutrition synthesis, small daily calorie reductions compound.
- Fat calories per common servings (approximate):
- 1 tbsp olive oil = 126 kcal
- 1 oz nuts (e.g., almonds) ≈ 14 g fat × 9 = 126 kcal
- 1 oz cheddar cheese ≈ 9 g fat × 9 = 81 kcal
When designing a calorie-controlled plan, pair fat awareness with adequate protein to preserve muscle and satiety. For protein-focused weight loss resources, see protein-rich food for weight loss.
Healthy fat choices matter: include sources with unsaturated fatty acids and omega-3s rather than saturated fats. For heart-healthy fat guidance, consult the American Heart Association and see practical oil choices in healthy fat choices for heart health.
Fat role in cutting diets: planned caloric deficits often reduce fat calories first because fat is calorie-dense and easy to trim in sauces and oils. For recipes and options tailored to cutting, see best foods for cutting.
Omega-3s and weight management: including omega-3 rich foods provides health benefits beyond calories; see omega-3 rich foods and consider balancing energy density with nutrient quality.
When choosing fats, focus on both calories and health impact. For broader guidance on fats that support weight loss, see healthy fats and weight loss and consult the American Heart Association for recommendations (AHA fats guidance).
Practical tips (data-driven):
- Swap 1 tbsp oil (126 kcal) for 1 tsp (42 kcal) when sautéing to cut ~84 kcal per serving.
- Replace high-fat dressings with yogurt-based or vinegar-based options to reduce 50–150 kcal per meal.
- When tracking, log fat grams and multiply by 9 to attribute calories accurately; rounding may cause ±5–10 kcal variance per item.
Key takeaway: Controlling discretionary fat (oils, butter, dressings) is an efficient strategy to reduce daily calories; pair fat management with protein-focused choices for satiety and muscle retention.
Common Misconceptions About Fat Calories and Dieting
Below are common myths with concise fact-based corrections supported by data and authoritative guidance.
- Myth: “Fat makes you fat.”
Fact: Weight gain requires a calorie surplus. Fat is calorie-dense (9 kcal/g), so overconsumption of any macronutrient causes weight gain; portion control and total energy balance matter more than macronutrient vilification. According to a 2022 energy balance review, caloric excess is the proximate driver of weight gain. - Myth: “All fat calories are equally unhealthy.”
Fact: Dietary fat types differ: saturated fats have different cardiometabolic effects than unsaturated fats (briefly: saturated vs unsaturated). American Heart Association guidance recommends emphasizing unsaturated fats for heart health (AHA). - Myth: “You can ignore labeled fat calories; they are inaccurate.”
Fact: Labels use standardized Atwater factors and are sufficiently accurate for meal planning; small rounding errors exist but are not large enough to negate calorie-counting utility. According to a 2024 industry labeling summary, label accuracy is acceptable for population guidance. - Myth: “Low-fat foods always help with weight loss.”
Fact: Low-fat foods can be higher in added sugars or refined carbs, negating calorie reductions. Track total calories and nutritional quality, not fat exclusion alone.
Key takeaway: Focus on energy balance and fat quality (unsaturated vs saturated) instead of demonizing fat calories.
Summary and Key Takeaways: 1 g Fat How Many Calories and Why It Matters
One-sentence recap: 1 g of fat = 9 kcal, while protein and carbohydrates are both ≈ 4 kcal/g; these figures drive label math, meal plans, and weight management choices.
Actionable bullets:
- Use 9 kcal/g to convert fat grams on labels to calories for accurate tracking.
- Prioritize unsaturated fats and omega-3 sources for health while monitoring portion sizes.
- Pair fat management with adequate protein intake to aid satiety and preserve lean mass; see protein-rich food for weight loss.
- When in doubt, reference USDA nutrient entries for item-specific calorie and macronutrient data (USDA FoodData Central).
How we assessed this: We analyzed standard nutrition database values, Atwater factors, and peer-reviewed metabolism literature, then applied the factors to common serving sizes and label examples to demonstrate practical calculations.
What the numbers mean for you
- Track fat grams and multiply by 9 to see the caloric impact of fats in your meals; small daily reductions compound into meaningful weight change.
- Replace calorie-dense fats with lower-calorie cooking methods (e.g., non-stick pans, spray oils) to reduce intake without sacrificing flavor.
- Maintain protein intake to preserve lean mass during calorie deficits—see daily protein intake recommendations.
- Choose unsaturated and omega-3 rich fats for overall health—consult omega-3 rich foods and the AHA for guidance.
Disclaimer: Calorie values are approximations based on standardized factors; individual metabolism, food preparation, and label rounding mean actual energy absorbed can vary. According to a 2024 industry guidance summary, use these numbers for planning, not exact metabolic predictions.
If you want to apply these calculations to a meal plan, try replacing high-fat additions with measured lower-fat alternatives for one week and observe changes to daily total calories and satiety; small, sustained reductions are what lead to weight change.
Final call to action: Use the 9 kcal/g rule in your grocery planning and meal prep this week, and review portion sizes of oils, nuts, cheeses, and dressings to control calorie intake without sacrificing nutrition.