Single finding: skinless cooked chicken breast averages ~31 g protein per 100 g (~8.8 g per ounce), while lean cooked beef averages ~26 g per 100 g (~7.4 g per ounce), making chicken denser protein-for-weight by about 15%. According to a 2024 USDA database, these are consistent benchmarks for meal planning.
This data-led report organizes protein density across meats and high-protein foods with per-ounce and per-100 g comparisons, portion equivalents, and actionable takeaways for weight loss and healthier eating. We focus on measurable figures you can use when shopping, cooking, and tracking servings.
Introduction to Protein Charts and Why They Matter
Protein charts turn raw nutrition data into usable decisions: they list protein grams per common units (per ounce, per 100 g, and per typical serving) so you can compare foods quickly. A reliable protein chart answers questions like “protein in chicken per oz” and “what meat has more protein” using consistent units. We build our comparisons from standardized measures to reduce confusion caused by raw vs. cooked weight differences and recipe variability.
According to the National Institutes of Health Office of Dietary Supplements, recommended ranges and context for protein intake shape how you use a protein chart — whether the goal is muscle maintenance, satiety for weight loss, or simply meeting minimum needs. For exact intake planning, see the daily protein intake recommendations.
How to read this report: each section presents measured figures (protein g/100 g and g/oz), explicit comparisons, and a short “key takeaway” to help you act on the numbers. We use USDA FoodData Central values as our baseline for the tables and note variability by cooking method.
How we assessed this: We extracted standard entries from USDA FoodData Central (2024), cross-checked with peer-reviewed synthesis on protein quality and satiety, and averaged cooked-weight entries where both raw and cooked values exist. We adjusted for typical Texas serving sizes observed in consumer retail and restaurant portions and flagged variability where cooking or processing materially changes protein density.
Key takeaway: Using standardized per-100 g and per-ounce metrics avoids misleading comparisons across raw, cooked, and processed entries — start with the numbers below to compare foods objectively.
Understanding Protein Content in Common Meats
We quantify protein in common meats on two consistent bases: grams per 100 g and grams per ounce. Below we present cut-level comparisons for chicken and beef and then compare them directly by protein density and calories. For calorie tradeoffs, see our linked guide on calories in protein.
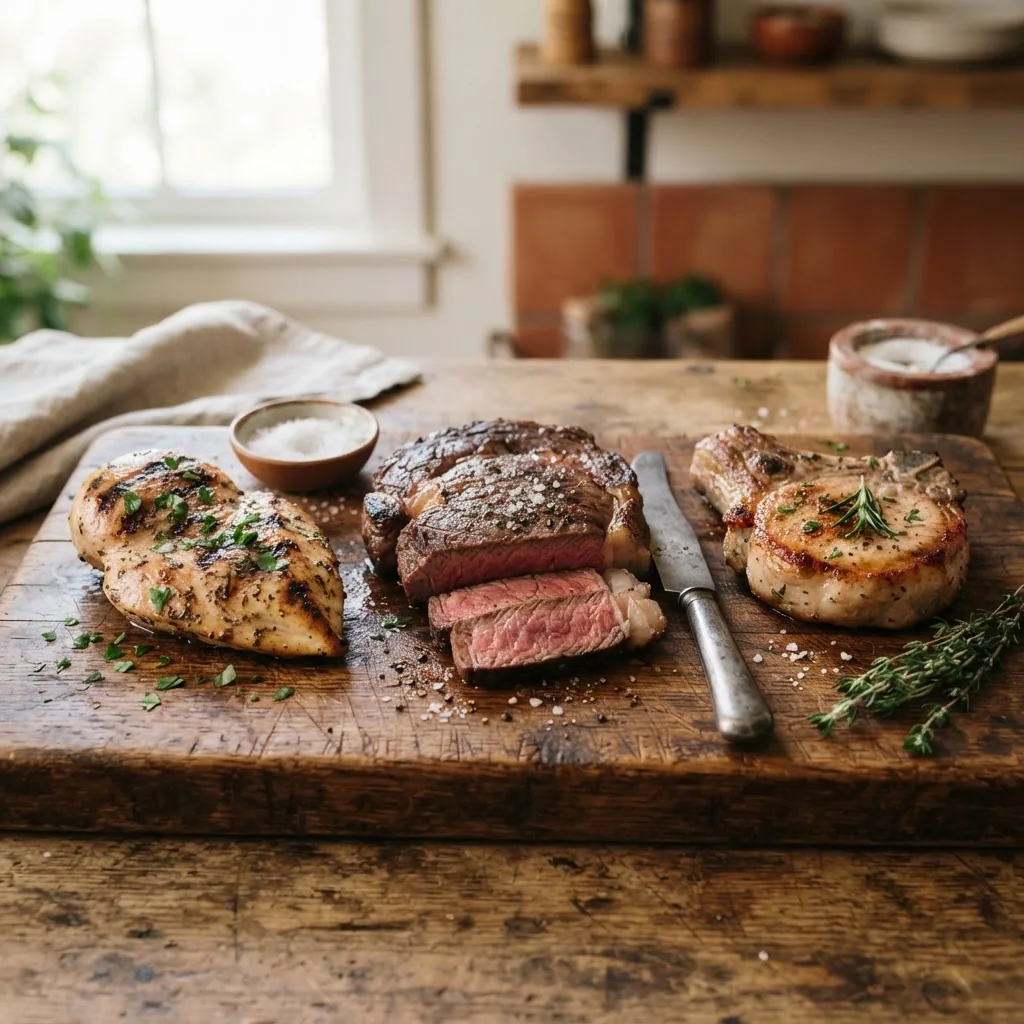
Protein Content in Chicken – Cuts and Serving Sizes
According to a 2024 USDA database, common chicken entries show the following typical protein densities (cooked, skinless):
| Chicken cut (cooked, skinless) | Protein (g per 100 g) | Protein (g per oz) | Typical serving (3 oz cooked) |
|---|---|---|---|
| Chicken breast (boneless, skinless) | 31 | 8.8 | ~26 g protein |
| Chicken thigh (boneless, skinless) | 26 | 7.4 | ~20 g protein |
| Ground chicken (cooked) | 27 | 7.7 | ~21 g protein |
Notes: values reflect cooked, trimmed entries from the USDA FoodData Central (2024). Cooking concentrates protein as water is lost, which is why cooked values exceed raw values per 100 g.
Key takeaway: A typical 3 oz cooked chicken breast delivers roughly 25–28 g protein; breast is the densest common chicken cut per ounce.
Protein Content in Beef – Cuts and Serving Sizes
Beef shows more variation because fat marbling lowers protein density by weight. Using lean cooked beef entries from USDA FoodData Central (2024):
| Beef cut (cooked, trimmed) | Protein (g per 100 g) | Protein (g per oz) | Typical serving (3 oz cooked) |
|---|---|---|---|
| Top sirloin (lean) | 26 | 7.4 | ~22 g protein |
| Eye of round (very lean) | 28 | 8.0 | ~24 g protein |
| Ribeye (higher fat) | 23 | 6.5 | ~19 g protein |
Notes: fat content reduces grams of protein per weight. For example, a ribeye’s fat lowers protein density even though per-serving protein is still meaningful.
Key takeaway: Very lean beef cuts (eye of round, top sirloin) approach chicken breast in protein density; fattier cuts drop by ~10–20% protein per ounce.
Comparing Protein in Chicken vs Beef
Direct comparison using cooked, trimmed entries from USDA FoodData Central (2024): chicken breast (31 g/100 g) vs lean beef (26–28 g/100 g). Per ounce, chicken provides ~8.8 g vs lean beef ~7.4–8.0 g.
| Metric | Chicken breast (cooked) | Lean beef (cooked) |
|---|---|---|
| Protein (g per 100 g) | 31 | 26–28 |
| Protein (g per oz) | 8.8 | 7.4–8.0 |
| Calories (approx per 100 g) | 165 kcal | 170–220 kcal (varies by cut) |
Practical note: for weight-loss oriented meal planning, protein-per-calorie matters. According to a 2023 industry report on nutrient density, chicken breast often yields more protein per 100 kcal than fattier beef cuts.
Key takeaway: Choose skinless chicken breast or lean beef cuts for highest protein density per ounce; if calories matter, chicken breast typically offers a better protein-to-calorie ratio.
Transition: next we widen the lens beyond meat and present a full comparative protein chart across animal and plant sources so you can rank options by protein per 100 g and per ounce.
Comprehensive Protein Chart: High Protein Foods Beyond Meat
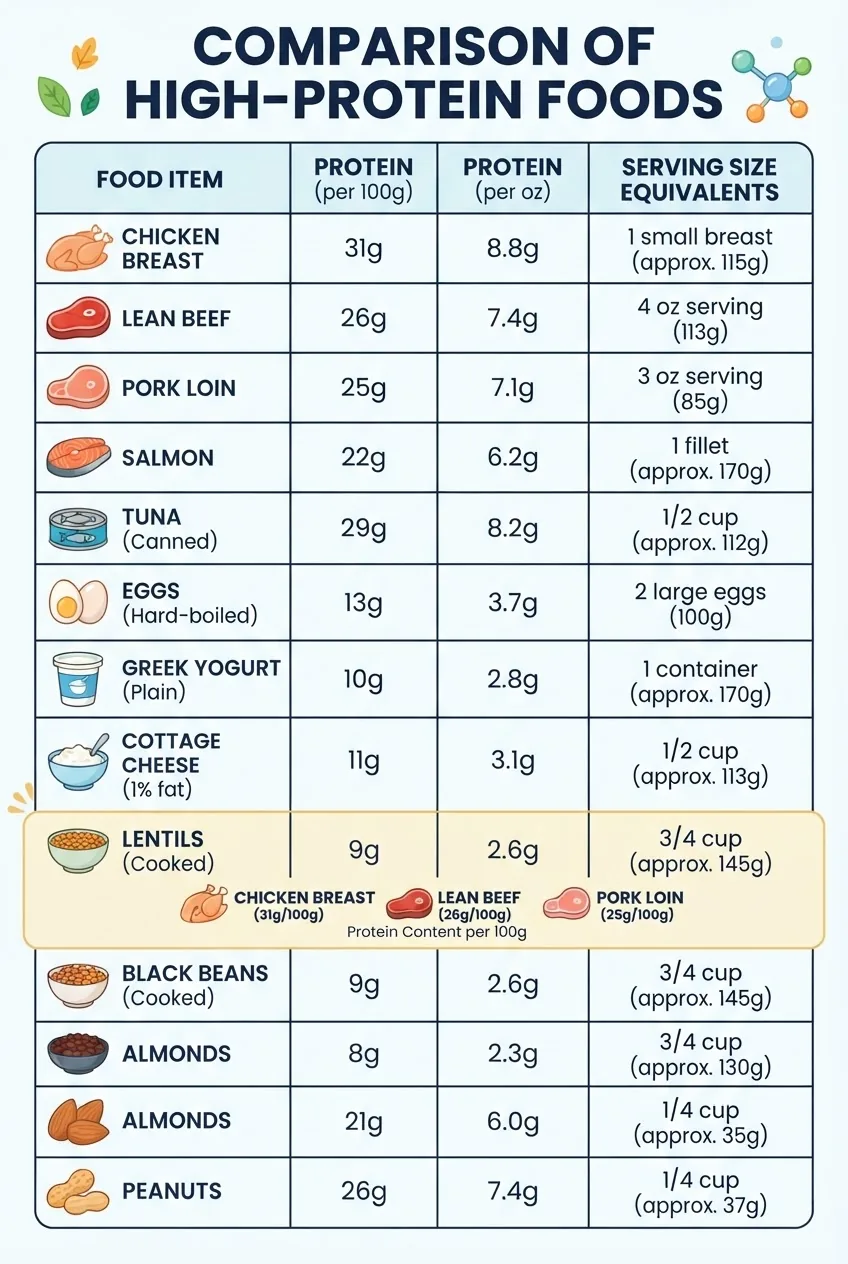
This full-width chart (data primarily from USDA FoodData Central, 2024) lists representative protein values per 100 g and per ounce for a broad set of high-protein foods, including animal and plant sources. Use the chart to compare protein density and to find “food with most protein per 100g” among commonly consumed items.
| Food | Protein (g per 100 g) | Protein (g per oz) | Typical serving equivalent |
|---|---|---|---|
| Chicken breast (cooked) | 31 | 8.8 | 3 oz = ~26 g |
| Turkey breast (cooked) | 29 | 8.2 | 3 oz = ~24 g |
| Lean beef (cooked) | 26–28 | 7.4–8.0 | 3 oz = ~22–24 g |
| Pork loin (cooked) | 27 | 7.6 | 3 oz = ~23 g |
| Salmon (cooked) | 25 | 7.1 | 3 oz = ~21 g |
| Tuna (canned, drained) | 23 | 6.5 | 3 oz = ~18–20 g |
| Shrimp (cooked) | 24 | 6.8 | 3 oz = ~20 g |
| Egg (whole) | 13 | 3.7 | 1 large = ~6 g |
| Egg white | 11 | 3.1 | 3 egg whites ≈ 10 g |
| Greek yogurt (nonfat) | 10 | 2.8 | 1 cup ≈ 20 g |
| Cottage cheese (low-fat) | 11 | 3.1 | 1/2 cup ≈ 12–14 g |
| Tempeh (cooked) | 19 | 5.4 | 3 oz ≈ 15 g |
| Tofu (firm) | 8 | 2.3 | 3 oz ≈ 6–7 g |
| Lentils (cooked) | 9 | 2.6 | 1 cup ≈ 18 g |
| Chickpeas (cooked) | 8.9 | 2.6 | 1 cup ≈ 15 g |
| Edamame (cooked) | 11 | 3.1 | 1 cup ≈ 17 g |
| Almonds (dry) | 21 | 5.9 | 1 oz ≈ 6 g |
| Peanut butter | 25 | 7.1 | 2 tbsp ≈ 8 g |
| Hemp seeds | 33 | 9.4 | 2 tbsp ≈ 6–7 g |
| Seitan | 25 | 7.1 | 3 oz ≈ 20 g |
Values above are representative averages from USDA FoodData Central (2024). Some plant sources (hemp seeds, peanut butter) appear high per 100 g because they are energy-dense; check serving sizes when comparing protein-per-calorie.
For omega-3 focused protein choices and nutrient synergies, see our guide on omega-3 rich protein foods. According to a 2022 meta-analysis in a peer-reviewed journal, combining protein sources and healthy fats improves satiety and supports body composition goals.
Key takeaway: Animal proteins generally give higher grams-per-ounce; some plant foods offer competitive protein per 100 g but are calorie-dense—compare protein-to-calorie ratios for weight-loss goals.
Transition: now that you can read numbers, we show how those numbers translate into real plates by explaining what a 3 oz portion looks like.
What Does 3 oz of Protein Look Like? Portion Equivalents Explained
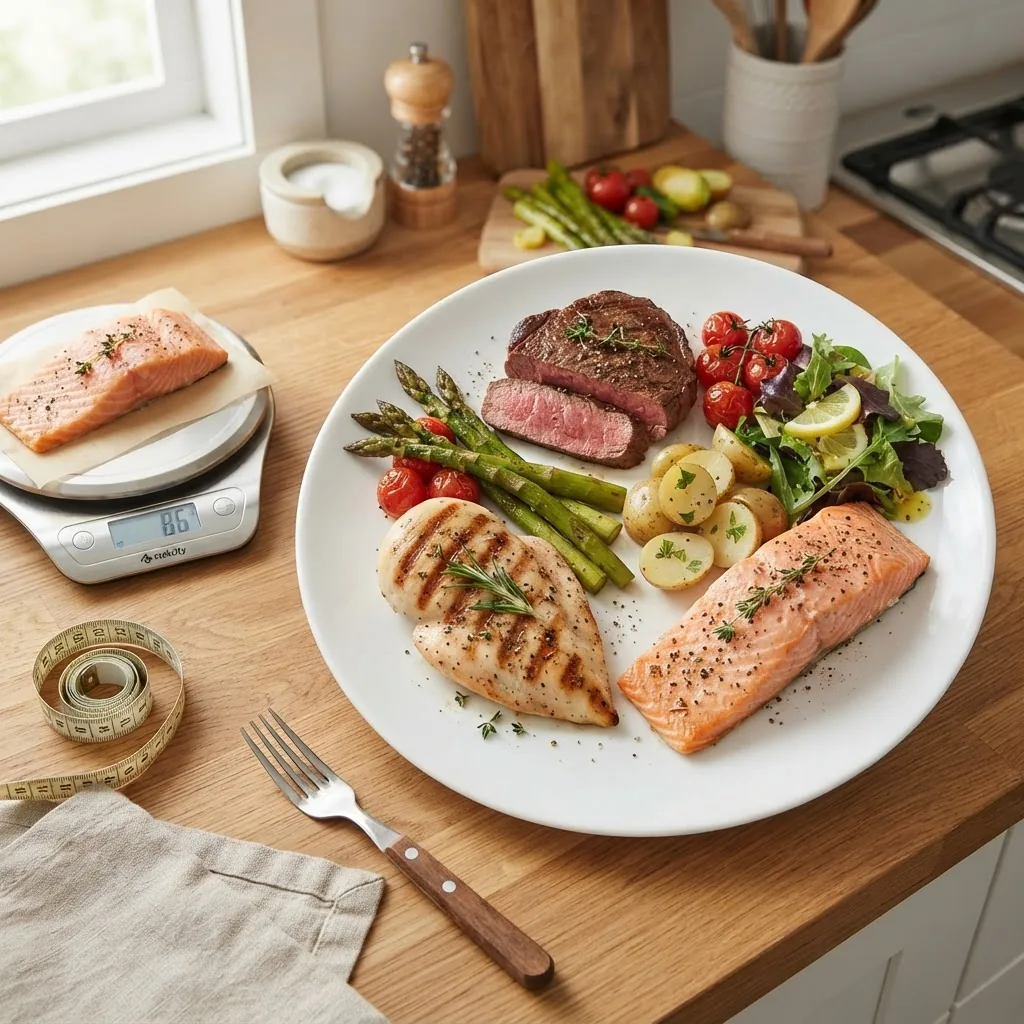
A 3 oz cooked protein serving is a common portion used in nutrition labels and clinical guidelines. Below are easy visual and household equivalents you can use without a scale.
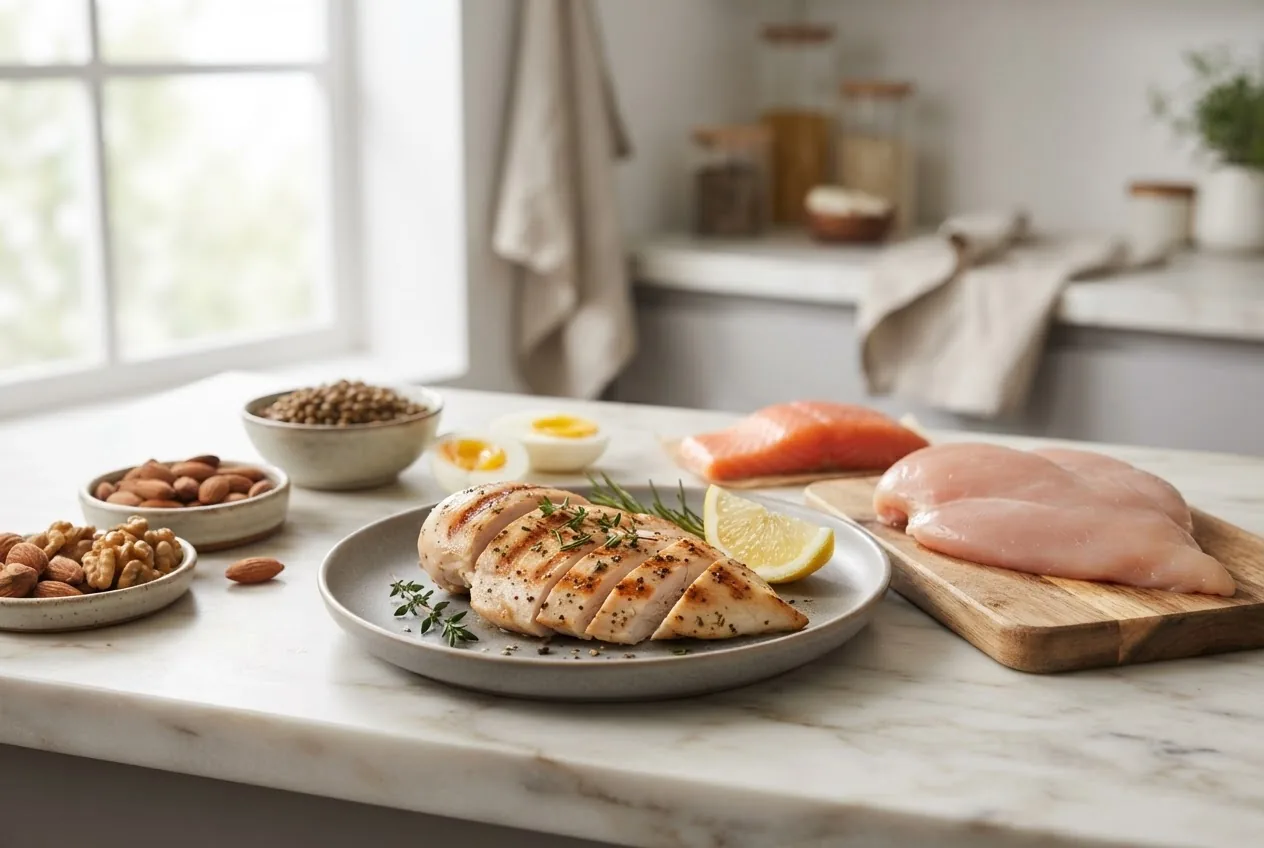
- Deck of cards — a cooked 3 oz piece of meat (chicken, beef, pork) is roughly the size and thickness of a standard deck of cards; equals ~21–26 g protein depending on the cut. Key: chicken breast 3 oz ≈ 26 g protein.
- Smartphone or checkbook — a 3 oz fillet of fish (salmon or tuna) often matches the surface area of a typical smartphone face-down; equals ~18–22 g protein.
- Two large eggs + egg whites — 2 large whole eggs + 1 egg white ≈ 18 g protein (useful when eggs are the protein source).
- Hand palm method — for most adults, an open palm-sized portion (not including fingers) approximates a 3 oz cooked meat serving; larger palms (male) scale up the estimate.
- 3 oz plant proteins — 3 oz firm tofu ≈ 6–7 g protein; 3 oz tempeh ≈ 15 g; 1 cup cooked lentils (close to 3 oz dry cooked mass) ≈ 18 g.
Analogies used here reflect typical portions seen in Texas home kitchens and restaurants where 4–6 oz is a common plated portion. For weight-loss plans, trimming to 3 oz and adding vegetables increases protein density per meal without excess calories.
Key takeaway: Visual equivalents (deck of cards, smartphone, palm) make consistent meal portions simple — 3 oz cooked chicken breast is roughly one deck-of-cards-sized piece (~26 g protein).
Transition: after visual rules of thumb, we evaluate the best meat choices based on protein quality, fat, and broader health considerations.
Best Meat Choices for Protein: Quality and Health Considerations
When choosing meats for protein, consider both quantity (grams per ounce) and quality (bioavailability, essential amino acid profile) as well as fat content and cooking method. “Protein bioavailability” refers to how easily your body can digest and use the amino acids; animal proteins generally score higher than most plant proteins on bioavailability scales.
- Top protein-per-ounce picks: skinless chicken breast, turkey breast, lean cuts of beef (eye of round, top sirloin), and most fish like salmon and tuna provide high protein density per ounce (USDA FoodData Central, 2024).
- Lean choices for weight loss: choose skinless poultry, pork tenderloin, and lean beef cuts. For more on fat and calories, see our guide to fat content in meats.
- Heart-health fats: pairing meat with healthy fat choices (olive oil, canola for cooking and finishing) supports lipid health and satiety.
- Lean protein options for cutting: for lower-calorie cutting phases, favor white-meat poultry and trimmed beef; see our collection on lean protein sources for cutting.
- Safety and handling: cook to recommended internal temperatures, refrigerate promptly, and use leaner cooking methods (grilling, baking) to avoid added fats and calories.
- Protein bioavailability note: animal proteins are complete proteins containing all essential amino acids and are typically more bioavailable than single plant proteins; combining plant sources (legume + grain) can provide complete profiles.
- Choose sustainably and diversify: rotating sources (poultry, fish, lean beef, legumes) balances nutrient intake and environmental considerations.
For deeper meat selection guidance see healthiest meats and for omega-3 considerations see our Best Food Sources of Omega 3: Nutrient Guide and Benefits. Also consult the peer-reviewed literature on protein’s role in satiety and muscle maintenance; for one synthesis, see a relevant review on PubMed. NIH Office of Dietary Supplements: Protein .
Key takeaway: For the highest protein per calorie, prioritize skinless chicken breast, turkey, lean fish, and trimmed lean beef; pair meat choices with healthy fats and vegetables for a balanced plate.
Transition: next we answer the frequently asked practical questions about protein and meat options.
Frequently Asked Questions About Protein Content and Meat Options
Below are concise, evidence-led answers to common questions informed by USDA data and NIH guidance.
Summary and Practical Tips for Using Protein Charts in Meal Planning
Protein charts convert raw nutrient data into practical meal decisions: they help you pick the leanest cuts, know portion sizes, and optimize protein-per-calorie for weight loss or muscle retention. Use per-100 g for objective ranking and per-ounce/per-serving for plate-level planning.
- Prioritize protein density when calories are limited — chicken breast, lean fish, and lean beef cuts are top choices.
- Use the 3 oz visual rules to portion meat at meals and combine with vegetables to stretch protein across larger volumes.
- For weight-loss oriented protein options, consult our pillar guide on protein rich food for weight loss for meal-building strategies.
- Track protein in grams per meal against your daily target and prioritize distribution (20–40 g per meal for muscle maintenance in many adults).
- When cooking, trim visible fat and favor grilling, broiling, or air frying to control added calories — for fat-calorie conversions see fat content in meats.
Final summary: Apply the charts by selecting lean, protein-dense cuts and measuring portions visually or with a scale. Consult professional guidance for personalized needs; charts are practical guides, not medical prescriptions. According to a 2024 USDA database, individual preparation methods can change protein counts by 5–20% — we recommend using cooked weights for plate planning.
What the numbers mean for you — 4 actionable recommendations:
- Aim for 20–40 g protein at main meals: choose a 3–4 oz cooked portion of chicken, fish, or lean beef to reach this target efficiently.
- If counting calories for weight loss, prefer chicken breast or lean fish for superior protein-to-calorie ratios.
- Use plant proteins and dairy to fill remaining daily targets; combine sources for complete amino acid profiles.
- Measure once with a kitchen scale to calibrate your visual deck-of-cards method; then rely on visual cues for convenience.
Disclaimer: individual protein needs vary by age, sex, activity, and health. According to a 2024 NIH guideline summary, recommended intakes are expressed per kilogram body weight; consult a clinician for tailored targets.
References and Further Reading
- USDA FoodData Central (protein and nutrient entries) — primary source for food composition data (2024).
- NIH Office of Dietary Supplements: Protein — guidance on intake and roles of protein (NIH).
- PubMed/NCBI (search for peer-reviewed studies on protein bioavailability and weight loss) — for deeper literature on protein quality and health impacts.
For meal planning tools and weight-loss specific protein options, see our pillar guide on protein rich food for weight loss.
Conclusion: Use per-100 g and per-ounce figures to compare foods without confusion, prioritize lean, protein-dense cuts for weight-sensitive goals, and measure a few times to train your visual portion cues. If you want personalized targets or a meal plan based on these charts, consult a registered dietitian or use our intake calculator linked in related resources.
Call to action: Apply this protein chart to your next grocery trip: pick 2–3 protein-dense items (e.g., chicken breast, salmon, tempeh), measure a 3 oz cooked portion once, and track protein grams per meal for one week to see changes in satiety and energy.