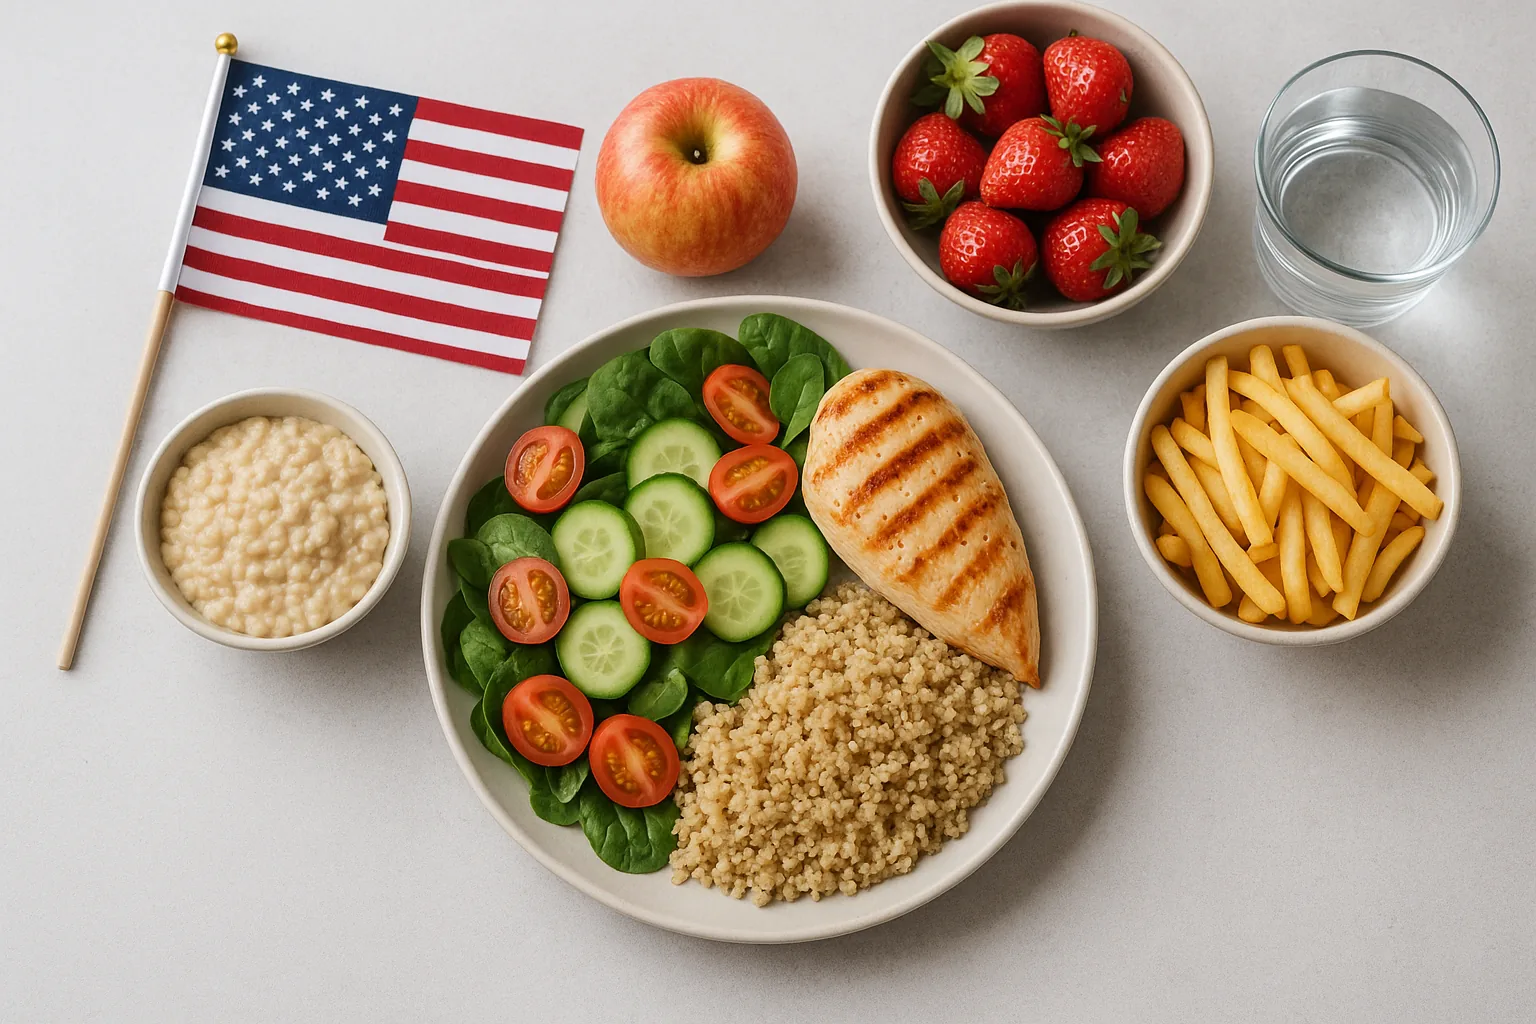
sad diet refers to the Standard American Diet (SAD): a pattern high in processed foods, added sugars, refined grains, saturated fats, and sodium, and low in whole fruits, vegetables, fiber, and certain micronutrients, which together shape nutrition in the United States and correlate with chronic disease trends.
What Is the SAD Diet? Understanding the Standard American Diet
Answer: The SAD diet is the prevailing dietary pattern in the U.S. characterized by frequent consumption of processed and convenience foods, high levels of added sugars, saturated fat, and sodium, with inadequate whole foods and fiber—driven by food availability, marketing, cost, and cultural habits.
Standard American Diet (SAD): A descriptive term for typical eating patterns in the United States emphasizing processed foods, refined grains, added sugars, high sodium, and low intake of whole fruits, vegetables, legumes, and whole grains.
The SAD diet is a population-level description, not a prescriptive meal plan. It summarizes average dietary intakes reported by nationally representative dietary surveys (for example, NHANES). According to a 2023 federal dietary assessment summary, many Americans consume more sodium and added sugars than recommended and fewer vegetables and whole grains than recommended (source: government dietary surveillance summary 2023).
Key background points:
- The phrase “Standard American Diet” (SAD) is used by nutrition researchers and public-health communicators to highlight patterns, not to label individuals.
- SAD patterns vary regionally—Southern and Midwestern foodways in the US, including Texas, often show higher fried food and sugar-sweetened beverage consumption, reflecting local culture and food availability.
- Nutritional assessment of the SAD typically uses 24-hour recalls, food-frequency questionnaires, and national surveys such as NHANES to estimate macronutrient and micronutrient intakes.
Because this guide focuses on the “why” and “what” of SAD nutrition basics for an American—particularly Texas—audience, it frames the diet within national statistics and regional eating habits to explain nutrition in the United States without prescribing calorie-specific plans.
Key Components of the SAD Diet: Foods and Nutrients
Answer: The SAD diet centers on processed and ultra-processed foods, refined carbohydrates, added sugars, high saturated fat and sodium, and insufficient fiber, fruits, vegetables, legumes, and whole grains—creating an energy-rich but nutrient-poor pattern.
Processed foods: foods altered from their original form for safety, convenience, or palatability; this category ranges from minimally processed (e.g., frozen vegetables) to ultra-processed (e.g., sugary cereals, packaged snacks).
The following categorized list details typical SAD foods and their nutritional implications, with examples and short analyses.
-
Refined grains and refined-carbohydrate staples
- Examples: white bread, white rice, refined pasta, many breakfast cereals.
- Nutritional note: higher glycemic load and lower fiber, vitamins, and minerals compared with whole grains; contributes to post-meal blood glucose spikes and lower satiety.
-
Added sugars and sugar-sweetened beverages
- Examples: soda, sweetened iced teas, energy drinks, flavored coffees, many bottled smoothies, and desserts.
- Nutritional note: high in “empty” calories, often displacing nutrient-dense foods; linked to excess caloric intake and metabolic risk.
-
Ultra-processed convenience foods
- Examples: packaged snacks, frozen entrees, instant noodles, processed meats (hot dogs, deli meats), most fast-food meals.
- Nutritional note: typically high in sodium, saturated fat, refined carbohydrates, and additives; may be low in fiber and essential micronutrients.
-
Saturated fats and certain animal fats
- Examples: fried foods, fatty cuts of red meat, butter, high-fat dairy products, many fast-food items.
- Nutritional note: saturated fat intake in SAD often exceeds recommended proportions, influencing cardiovascular risk factors such as LDL cholesterol.
-
High-sodium foods
- Examples: canned soups, processed deli meats, restaurant-prepared meals, snack foods, condiments.
- Nutritional note: sodium is used for preservation and flavoring; chronic high intake is associated with hypertension and related cardiovascular risks.
-
Low-fiber, low-vegetable and low-legume intake
- Examples: diets dominated by refined grains and meats rather than beans, whole grains, and vegetables.
- Nutritional note: Dietary fiber is typically underconsumed in SAD, reducing digestive health benefits and increasing cardiometabolic risks.
-
Insufficient fruits, vegetables, nuts, seeds, and seafood
- Examples: limited servings of fresh produce; low intake of fatty fish and plant-based sources of omega-3s.
- Nutritional note: inadequate dietary variety reduces intake of vitamins A, C, D (often low in SAD), potassium, magnesium, and beneficial fatty acids.
-
Alcohol (where applicable)
- Examples: frequent drinking or high-calorie cocktail consumption, which can add empty calories and affect nutrient absorption.
- Nutritional note: alcohol replaces nutrient-dense calories and can interact with chronic disease risk and medication use.
Real-world examples of typical American meals under the SAD pattern and quick nutritional analysis:
- Breakfast: sugary cereal with whole milk + orange juice. Analysis: high in added sugar, refined grain; moderate saturated fat; low fiber compared with oatmeal with fruit and nuts.
- Lunch: fast-food cheeseburger, fries, soda. Analysis: high in saturated fat, added sugar, sodium; low in vegetables and fiber.
- Dinner: frozen entrée (mac-and-cheese) + packaged garlic bread. Analysis: refined carbs, processed cheese, elevated sodium and saturated fat, minimal produce.
- Snack pattern: potato chips, candy bars, and energy drinks. Analysis: energy-dense, nutrient-poor, and likely to exceed recommended daily sodium and sugar.
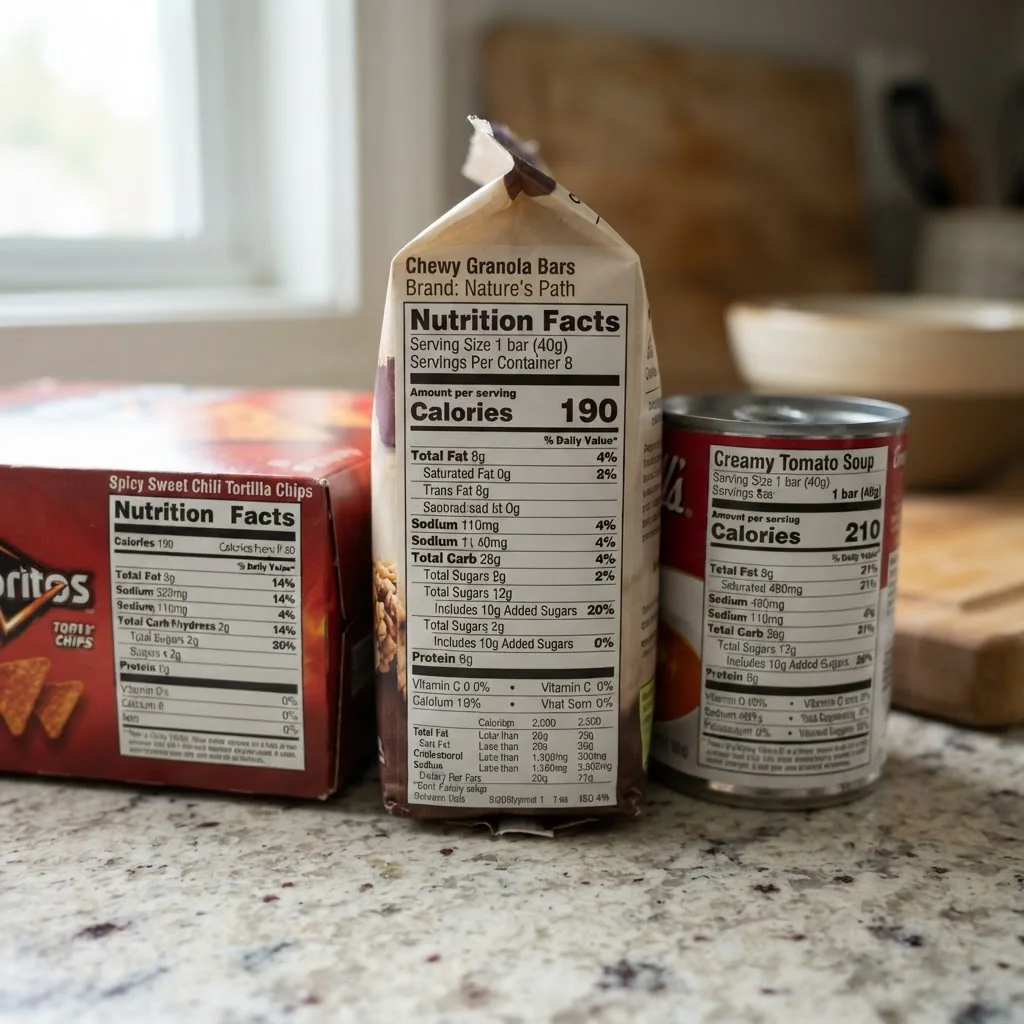
Label-based walkthrough: looking at a common packaged snack bar in a SAD grocery basket often reveals 10–20 g added sugars, 3–5 g fiber, and 150–250 kcal per bar—an unfavorable sugar-to-fiber ratio compared with whole-food snacks.
Nutritional Profile and Health Implications of the SAD Diet
Answer: The SAD diet typically provides excess energy from refined carbohydrates, added sugars, saturated fats, and sodium while supplying inadequate fiber, certain vitamins and minerals, and protective unsaturated fats—contributing to higher rates of obesity, type 2 diabetes, hypertension, and cardiovascular disease.
Macronutrients: Macronutrients are the main nutrient classes—carbohydrates, proteins, and fats—providing energy and structural components for the body.
The SAD typically shows the following macronutrient features based on national dietary surveillance:
- Carbohydrates: Often dominated by refined carbohydrates and added sugars rather than complex carbohydrates and whole grains; results in high glycemic load meals.
- Fats: Greater proportion of saturated and trans fats from fried and processed foods; lower intake of polyunsaturated fats (like omega-3s) found in fish and nuts.
- Protein: Adequate or sometimes excessive total protein—often from processed and higher-fat animal sources rather than lean or plant-based proteins.
Micronutrients commonly lacking or excessive in SAD:
- Commonly low: dietary fiber, vitamin D, potassium, magnesium, calcium (in some groups), and certain B vitamins when whole grains are lacking.
- Commonly excessive or borderline: sodium and added sugars; saturated fat often exceeds recommended limits for many adults.
Specific statistics and study references:
- According to a 2023 federal dietary surveillance summary (NHANES-based overview), average added sugar intake among U.S. adults exceeds the 10% of energy recommendation in many age groups (source: government dietary surveillance summary 2023).
- According to a 2024 industry report summarizing CDC data, sodium intake for most adults remains above the 2,300 mg/day recommended limit, largely due to processed and restaurant foods (source: CDC data synthesis 2024).
- According to a 2022 American Heart Association scientific review, diets high in processed meats, sodium, added sugars, and saturated fats are associated with increased cardiovascular risk across observational cohorts (source: AHA scientific review 2022).
Fiber intake in the SAD: Fiber—found in whole grains, legumes, fruits, and vegetables—is typically underconsumed. Low fiber intake correlates with poorer glycemic control, less satiety, and altered gut microbiota composition linked to metabolic disease risk.
Six classes of nutrients: For readers who want a deeper breakdown of essential nutrient groups and how the SAD aligns with them, see the six classes of nutrients.
Population health correlations:
- Obesity: According to a 2023 CDC report, adult obesity prevalence in the U.S. remains above 30% in many states, with dietary patterns high in calorically dense, nutrient-poor foods being a major contributor (source: CDC 2023 report).
- Type 2 diabetes: Epidemiological analyses summarized in a 2021 peer-reviewed meta-analysis show strong associations between high intake of sugar-sweetened beverages and incident type 2 diabetes (source: peer-reviewed meta-analysis 2021).
- Cardiovascular disease: The American Heart Association links dietary sodium, saturated fat, and ultra-processed food patterns to elevated blood pressure and cholesterol—key CVD risk factors (source: AHA scientific statements 2022).
Label walkthrough and trade-offs: When comparing two packaged dinners—a frozen lasagna and a home-prepared whole-grain pasta with vegetables—calorie counts may be similar, but the frozen lasagna often provides more sodium, more saturated fat, less fiber, and fewer micronutrients per serving. This exemplifies that energy content alone does not measure diet quality.
Population variability and caveats: Individual health outcomes depend on genetic factors, physical activity, socioeconomic status, and access to healthy food. The SAD characterization does not imply every person eating in the U.S. follows the same pattern; rather, it highlights dominant trends with population-level consequences documented by NHANES and CDC reports.
Cultural and Socioeconomic Influences on the American Diet
Answer: Cultural preferences, food industry marketing, income, time constraints, and geographic access (including food deserts) shape why the SAD is prevalent—factors that affect what people buy, prepare, and eat across communities, including Texas urban and rural areas.
Food deserts: Areas with limited access to supermarkets or fresh food retailers; residents often rely more on convenience stores and fast food.
How these influences operate in practice:
- Income and cost: Lower-cost, energy-dense processed foods can be less expensive per calorie than fresh produce, influencing purchase decisions for households on tight budgets.
- Time and convenience: Two-worker households or long work hours (common in many Texas cities) favor quick, prepared meals and drive-through dining, which tend to be higher in sodium and saturated fat.
- Food marketing and industry influence: Aggressive marketing of low-cost processed foods and sugar-sweetened beverages—especially in media targeting children and young adults—shapes preferences and normalizes frequent consumption of those products.
- Fast-food prevalence and cultural patterns: Southern and Texan cuisines can include fried foods, barbecue, and comfort dishes; when prepared in traditional ways frequently, these items can contribute disproportionately to saturated fat and sodium intake.
Data examples and real-world context:
- According to a 2022 national community nutrition survey analysis, neighborhoods with lower supermarket density showed higher rates of fast-food consumption and lower produce intake (source: peer-reviewed community nutrition analysis 2022).
- According to a 2023 CDC behavioral risk factor surveillance synthesis, lower-income households report greater reliance on convenience foods and sugar-sweetened beverages, linking socioeconomic status with SAD-like patterns (source: CDC 2023 surveillance synthesis).
Policy and systemic factors:
- Food industry practices such as product formulation (increasing salt and sugar for palatability), portion-size marketing, and placement strategies in stores influence consumer choices at scale.
- Federal and state policies affect food availability: SNAP benefits, school meal standards, and local zoning for grocery stores or fast-food outlets alter the local food environment.
Practical Texas example:
In many Texas urban zones, drive-through culture and long commuting times encourage grab-and-go meals; in rural Texas counties, longer distances to supermarkets and fewer healthy options raise the reliance on processed and shelf-stable foods. These real-world factors explain a portion of the SAD diet’s persistence beyond individual preference.
How the SAD Diet Compares to Balanced Diet Principles
Answer: Compared with federal balanced-diet frameworks like MyPlate and the USDA Dietary Guidelines, the SAD diverges by providing excess energy from added sugars, saturated fat, and sodium while under-delivering on fruits, vegetables, whole grains, nuts, and legumes.
MyPlate: A USDA visual guideline dividing a plate into fruits, vegetables, grains, protein, and dairy to promote balanced meals.
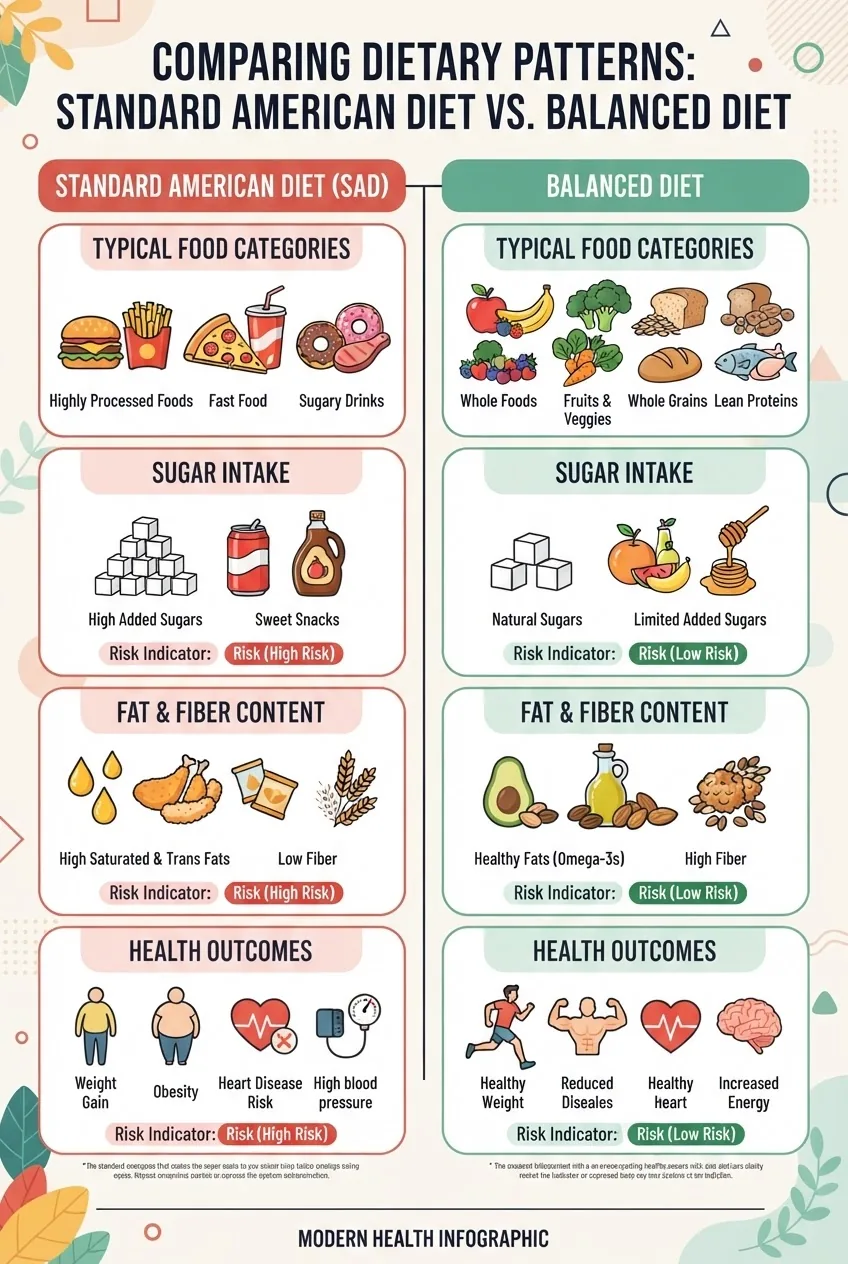
The table below compares core aspects of the Standard American Diet and balanced diet principles used in public health guidance.
| Aspect | Standard American Diet (SAD) | Balanced Diet Principles (USDA MyPlate / Dietary Guidelines) |
|---|---|---|
| Primary foods | Ultra-processed foods, refined grains, sugar-sweetened beverages | Whole fruits, vegetables, whole grains, lean proteins, healthy oils |
| Added sugar | High; often >10% energy | Limited to <10% energy per guidelines |
| Saturated fat | Often above recommended limit | Replace with unsaturated fats when possible |
| Sodium | Frequently exceeds 2,300 mg/day | Limit sodium; emphasize fresh foods |
| Fiber | Low; most Americans below recommended intake | High-fiber whole grains, legumes, fruits, vegetables encouraged |
| Health outcomes | Higher cardiometabolic risk at population level | Improved weight management and reduced chronic disease risk |
For a foundational explanation of balanced diet concepts that contrasts directly with SAD deficiencies, see the balanced nutrition guide.
Visual examples help: for curated visual representations contrasting SAD-style plates and balanced plates, see the visualizing healthy meal plans.
visualizing healthy meal plans
The USDA Dietary Guidelines recommend a dietary pattern emphasizing vegetables, fruits, grains (half whole), lean protein, and low-fat dairy, with limits on added sugars, saturated fat, and sodium (source: USDA Dietary Guidelines).
For readers who prefer the classic plate graphic and its modern equivalents, review the healthy plate model, which lays out proportion guidance that contrasts with typical SAD plate proportions.
External references supporting comparisons:
- USDA Dietary Guidelines: https://www.dietaryguidelines.gov/ (official guidance on balanced dietary patterns).
- CDC nutrition statistics overview: https://www.cdc.gov/nutrition/index.html (data on population intakes and related disease trends).
Practical Tips for Reducing SAD Diet Impact and Moving Towards Balance
Answer: Reduce SAD impact by prioritizing whole foods, increasing fiber and produce, swapping processed items for simple natural alternatives, checking labels for added sugar and sodium, and planning meals that fit time and budget constraints.
Natural foods: Foods that are minimally processed and close to their whole form, such as fresh fruits, vegetables, whole grains, nuts, seeds, legumes, and fresh lean proteins.
Actionable numbered steps tailored to U.S. contexts (including Texas):
- Start with one swap per meal. Example: replace soda with sparkling water and lemon; swap white bread for a whole-grain alternative; choose grilled lean protein over fried.
- Prioritize fiber at each eating occasion. Aim to include a vegetable, fruit, legume, or whole grain with each meal—for example, black beans with rice, or an apple with nut butter.
- Read labels for sodium and added sugars. Look for items with <140 mg sodium per serving (low) where possible and check sugar content: ideally under 5–8 g per serving for snacks. Use the Nutrition Facts panel to compare similar products.
- Cook in batches and use simple meals for busy schedules. Prepare grain bowls with roasted vegetables and a lean protein to reheat through the week; slow-cooker or sheet-pan meals reduce time burden.
- Use community and retail resources. Seek local farmer’s markets, community-supported agriculture (CSA), or in-store discount programs for produce; many Texas cities run weekend markets with seasonal produce.
- Practice mindful portioning and plate composition. Fill half your plate with vegetables, one quarter with lean protein, and one quarter with whole grains—this echoes MyPlate principles and reduces overreliance on processed sides.
- Plan for healthier restaurant choices. Share large portions, choose grilled or baked options, ask for sauces on the side, and swap fries for a side salad or steamed vegetables.
- Replace one processed snack per day with a whole-food option. E.g., swap chips for air-popped popcorn or nuts (portion-controlled) and replace candy with fruit.
- Gradual beverage changes. Use smaller glasses, dilute juice with water, and reduce the frequency of sugar-sweetened beverages.
- Use evidence-based resources and meal plans when calorie control is needed. For readers who want structured calorie goals within balanced nutrition, the site offers targeted guides such as the 1200 calorie meal plan and the 1400 calorie meal plan as practical starting points.
Budget-minded tactics:
- Buy frozen vegetables and fruit—nutritionally comparable to fresh and often lower-cost.
- Buy whole grains in bulk and prepare beans from dry instead of canned to reduce sodium and cost.
- Use seasonal produce for better prices and flavor; in Texas, consider summer melons, winter citrus, and local greens.
Behavioral strategies:
- Make small, sustainable changes rather than a full overhaul; habit formation is key for long-term adherence.
- Track one or two metrics such as servings of vegetables per day or number of sugar-sweetened beverages replaced per week.
Common Misconceptions About the SAD Diet and Nutrition in the United States
Answer: Common myths include that all American diets are identical, that “natural” labeling guarantees healthfulness, and that named diets are inherently superior; reality is nuanced—diet quality varies by access, culture, and food choices, and labels can mislead.
The following Q&A-style clarifications address frequent misunderstandings.
Is the SAD diet the same for everyone in the United States?
No—there is considerable variation by region, culture, income, and age; the “SAD” label summarizes dominant trends (e.g., high processed food consumption) but does not describe every individual’s diet.
Are “natural” foods always healthier than typical SAD foods?
Not necessarily; “natural” is not tightly regulated and can appear on products that still contain added sugars or high sodium—read labels and focus on whole-food ingredients.
Do named diets (keto, paleo, Mediterranean) outperform addressing SAD issues?
Named diets vary in approach and evidence; the key advantage is whether they reduce processed foods and improve nutrient density—see our popular diets guide for contrasts.
Is low calorie always the same as high-quality nutrition?
No—calories measure energy, not nutrient density; a calorie-controlled plan can still be nutrient-poor if it relies on processed foods, which is why balanced food choices matter alongside calorie targets.
Does eating less fat always make my diet healthier?
Not automatically—reducing saturated fat and replacing it with unsaturated fats improves heart health, but swapping fats for refined carbohydrates or sugar does not improve diet quality.
These clarifications emphasize accurate understanding of diet quality rather than oversimplified judgments.
Transitioning from myth to fact supports practical behavior change while acknowledging socioeconomic and cultural realities described earlier.
Conclusion
This guide explains the sad diet—the Standard American Diet—by detailing its typical foods, macronutrient and micronutrient patterns, health implications, and the cultural and economic drivers that sustain it. Improving diet quality focuses on reducing ultra-processed foods, increasing whole fruits, vegetables, legumes, whole grains, fiber, and healthier fats. For practical next steps, start with one swap per meal, check labels for added sugars and sodium, and use the balanced nutrition resources linked above to plan sustainable changes. Ready to take the next step? Review the balanced nutrition guidance or choose a structured meal plan from our practical guides to begin.