Balanced diet images help you turn nutrition rules into plates you can cook, photograph, or pack. By the end of this hands-on guide you will be able to design, photograph, and use visual meal templates to plan daily menus in one 90–120 minute working session; skill level: beginner to intermediate (basic kitchen and smartphone camera skills required).
Before you read the visual steps, review foundational definitions and resources so the images you rely on reflect accepted guidance. balanced diet principles explained and diet definition and meaning are useful primers if you want the full text definitions before using visuals.
Introduction to Balanced Diet Images
This section explains what you will see in the rest of the guide and how to use photographic and diagrammed images as learning tools. A balanced diet combines foods from major food groups in portions that match activity, age, and health goals. Visual learning—using photos, plate models, and labeled diagrams—transforms abstract guidance into concrete meal-building actions. Visuals are especially effective for showing portion control, food group balance, and real-plate examples that people can replicate at home or at a Texas cookout without needing calorie math.
Visual aids support quick decisions at the grocery store, prepping line-ups on the counter, and consistent plating during busy weeks. According to the 2023 USDA Dietary Guidelines, plate-based visuals such as MyPlate are aligned with U.S. public health messaging and remain a practical default for most adults and families. For readers who prefer definitions, the linked primer will clarify technical terms before you start.
Before you start practical steps, gather the tools listed below and set aside roughly 90–120 minutes for your first visual meal-planning session—less time for repeat use.
Before you start
- Smartphone or camera with overhead capability and natural light (morning or late afternoon).
- Plate collection: two dinner plates and one bowl for visual comparison.
- Measuring spoons, a digital kitchen scale (grams/oz), and a 1-cup measuring cup.
- Notebook or printable template for notes; see healthy diet worksheet templates.
- Reference guides: a MyPlate printout, a simple portion chart, and a vitamin chart like the vitamin-rich foods chart.
- Optional: plates with rim markers or a portion plate accessory for plate-section visual checks; see the portion plate control guide.
Transition: With tools ready, we’ll break down meal components visually so you can judge images against reliable standards.
Understanding the Components of a Balanced Meal Through Images
Images teach the composition of meals more quickly than lists. When I first trained community volunteers in Austin, showing a photo of a plate with half non-starchy vegetables, one-quarter lean protein, and one-quarter whole grains produced an immediate “aha” across diverse diets. Use this section to learn how food groups, plate portions, and nutrient balance appear in images so you can evaluate or create your own “images of a balanced meal.”
Start by recognizing the five food groups as visual blocks: fruits, vegetables, grains, protein, and dairy. The USDA MyPlate diagram is a simple color-blocked reference: half your plate vegetables + fruits, one-quarter grains, one-quarter protein, and a small dairy side. food pyramid and healthy plate model provides historical context and how plate models evolved from pyramid diagrams.
Below are component-by-component image cues and how to identify them in photos:
- Vegetable images: Look for volume, color variety, and minimal sauces. In photos, cooked or raw vegetables that occupy half the plate (or more) indicate a vegetable-forward meal. Contrast leafy greens, cruciferous vegetables, and starchy vegetables visually—starchy veg (potatoes, corn) should appear in smaller sections than non-starchy veg.
- Fruit images: Fruit often appears as a side or garnish in images. A single small fruit serving equals about 1 cup fresh berries or one medium apple—visually, fruit filling a small bowl or a palm-sized portion is a standard cue.
- Grain visuals: Whole grains show texture (visible bran, defined grains) in photos. A grain portion roughly the size of your fist or one-quarter plate in MyPlate-based images signals an appropriate visual grain serving.
- Protein sources visuals: Lean proteins (chicken breast, fish fillet, legumes) should appear as a palm-sized portion occupying about one-quarter of the plate. Cooked legumes may look bulkier; compare volume to grains in the photo to judge relative protein content.
- Dairy in images: Often shown as a small cup of milk, a yogurt container, or a wedge of cheese. Dairy portions tend to be small visually—about 1 cup milk, or 1/2 cup yogurt—so dairy in photos is typically accessory rather than plate filler.
Portion control in imagery depends on context: a weight-loss plate will show smaller grains and higher vegetable volume compared to an athlete’s plate. For readers wanting numeric intake context tied to images, consult adequate intake nutritional requirements for recommended daily targets. When you view a meal photograph, mentally map each food item to a group and check the visual balance: is half the plate vegetables and fruit? Is protein roughly a quarter?
Visual portion size comparison: use your hand as a consistent scale in images—palm for protein, fist for grains/veggies, thumb for fats. When an image lacks a scale object, look for common items (fork, cup) to estimate serving size. If an image exaggerates portion edges (oversaturated lighting, forced perspective), note the distortion and reduce estimated portions by 25% when planning.
Nutrient balance in photos: well-constructed images will show a mix of macronutrients—complex carbohydrates (whole grains), lean proteins, and healthy fats (olive oil, nuts) in visible forms. Highlighted micronutrient-dense foods such as colorful vegetables and berries imply vitamin and mineral coverage; refer to the vitamin-rich foods chart to map pictured items to common micronutrients.
Case example (Texas-style): a photographed lunch plate from a community outreach event in San Antonio showed grilled flank steak (protein, palm-sized), black bean salad (legumes—protein and carbs), roasted peppers and spinach (vegetables filling half the plate), and a small corn tamale (starchy grain). Volunteers compared that image to a MyPlate photo and adjusted the tamale to a 1/4-cup portion in their own meals—visual correction in action. This kind of practical, regionally familiar example demonstrates how images translate to behavior.
Transition: now that you can read a plate photo, learn the types of images to collect and how each image type serves a different learning purpose.
Exploring Various Types of Balanced Diet Images and Their Uses
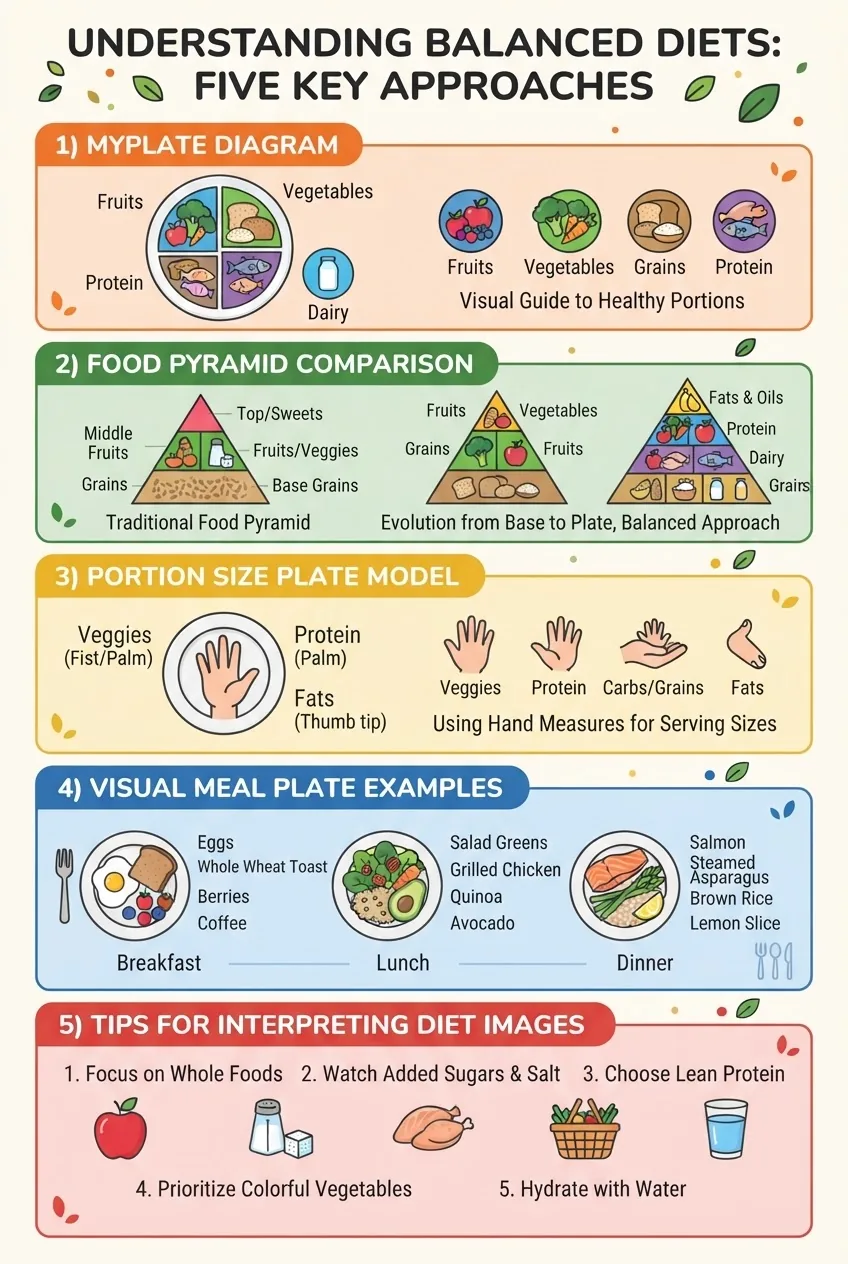
- MyPlate diagrams — Use case: quick household guidance and school nutrition education. MyPlate images visually assign half the plate to fruits & vegetables, and quarters to grains and protein. For authoritative context, see the USDA MyPlate resources: MyPlate.
- Food pyramid visuals — Use case: historical comparison and layered nutrient emphasis. The Food Pyramid 1990 guide provides a historical frame; compare that to plate models to explain shifts in public guidance. Food Pyramid 1990 guide.
- Portion-plate diagrams — Use case: precise portion visualization for weight management. Diagrams showing exact cup or ounce equivalents per plate section are useful in clinical education and in preparing a portion plate control guide. They help users translate a photo into measurable servings. portion plate control guide.
- Meal portion diagrams — Use case: meal prep and batch cooking. These images display containers and compartments (bento, meal prep boxes) labeled for food groups; they are directly transferable to weekly meal plans and lunch packing.
- Photographic balanced meal examples — Use case: inspiration and real-life replication. High-quality photos of breakfast, lunch, dinner, and snacks show texture, plating tricks, and portion cues. Pair these with notes on cooking methods and substitutions.
- Infographic guides — Use case: education and social sharing. Infographics combine diagrams, photos, and short tips—perfect for community classes or clinic handouts. For carbohydrate-specific image sets, see consistent carbohydrate diet principles.
- Before-and-after portion comparisons — Use case: behavior change and coaching. Two photos side-by-side (oversized portion vs. balanced portion) are effective for demonstrating small, actionable reductions in grains or fats.
- Food group icon sets — Use case: quick memory aids. Icons that represent fruits, vegetables, grains, protein, and dairy are useful when designing worksheets, presentations, and printable menus.
- Interactive image templates — Use case: workshops and meal planning apps. Clickable or annotated plate images let users swap items and immediately see how balance changes.
- Comparative diet plates — Use case: illustrating how diet styles (Mediterranean, plant-based, omnivore) translate into plate visuals. When teaching clients, showing multiple diet-style plates reduces resistance by demonstrating adaptability.
Transition: now we’ll put those image types into action with step-by-step instructions to create your own visual meal plans.
How to Use Balanced Diet Images to Create Your Own Healthy Meal Plans
Follow this step-by-step practical workflow to produce visual meal plans you can use for a week of meals. Each step is written for hands-on execution with timing and measurable thresholds.
- Collect reference images (20–30 minutes) — Gather at least 12 images: four MyPlate-style photos (breakfast, lunch, dinner, snack), four real-food photographic examples, and four portion diagrams. Store them in a single folder. Use high-resolution photos (minimum 2000 px on the long edge) and natural-light images to preserve detail.
- Label each image by food groups (15–20 minutes) — For every image, write short labels: vegetables, fruit, grains (whole/refined), protein (type + portion grams), dairy, and fats. When estimating protein grams in photos, use palm-size = 85–100 g cooked meat, or 1/2 cup cooked legumes = 120 g; these are visual conversion rules used by dietitians.
- Map images to meal goals (15–20 minutes) — Create three columns in a worksheet: Weight-management, Maintenance, Energy-focused. Place each image under the column it best supports. For calorie-specific planning, consult guides like a balanced 1200 calorie meal plan or a 1400 calorie healthy balanced diet plan when you need exact energy targets.
- Create a weekly visual menu (30–40 minutes) — Using the mapped images, build a seven-day grid (breakfast, lunch, dinner, snack). For each slot, paste a plate photo and note obvious swaps (e.g., swap brown rice for white rice). Use the “palm, fist, thumb” rule visibly in notes: palm = protein, fist = vegetables/grains, thumb = fats.
- Produce alternate portion images (20–30 minutes) — For each meal, create a second image showing a smaller carb portion and a larger vegetable portion (use the same plate and lighting). This comparative approach helps with portion control training and replication for different needs (weight loss vs. energy needs).
- Annotate with simple nutrient cues (15–20 minutes) — Add brief annotations to images: “Ω = unsaturated fat source” or “Fiber + Vitamin C present.” Keep annotations to three bullets per image so visuals remain uncluttered. When referencing heart-healthy choices, cite the American Heart Association: American Heart Association.
- Assemble printable templates (20–30 minutes) — Create a printable one-page guide for each meal type (breakfast, lunch, dinner) with the photo, portion diagram, and three swap suggestions for local ingredients (e.g., Texan swaps: replace black beans with pinto beans; choose grilled fish over fried).
- Test in real life (one week) — Use the visual menu in real meal prep for one week. Keep notes: preparation time, hunger level after meals (scale 1–5), and satisfaction. Revise images that consistently lead to leftover waste or low satiety.
- Use templates for batch cooking — For batch cook sessions, place annotated images next to serving containers to ensure you portion as planned: target 3/4–1 cup cooked whole grains per lunch for active maintenance days, or 1/2 cup for lower-energy days.
- Scale and adapt for different populations — For children reduce adult protein portions by 25–40% and increase vegetable variety; elderly clients may prefer softer textures and slightly higher protein per meal. For professional reference on portion adjustments, consult the Academy of Nutrition and Dietetics: Academy of Nutrition and Dietetics.
Transition: armed with a visual menu, view concrete example plates to guide specific meals across the day.
Examples of Balanced Diet Images for Different Meal Types
Below are categorized image descriptions you can recreate or use directly in client handouts. Each example includes a short production note so you can photograph and annotate the plate accurately.
Breakfast
Image description: An oatmeal bowl topped with mixed berries and a tablespoon of chopped nuts, a small glass (1 cup) of low-fat milk, and a side of sliced banana. Visual cues: oats (1 cup cooked) occupy a small bowl, berries (1/2 cup) provide color, nuts (1 tbsp) indicate healthy fat, milk shows dairy portion.
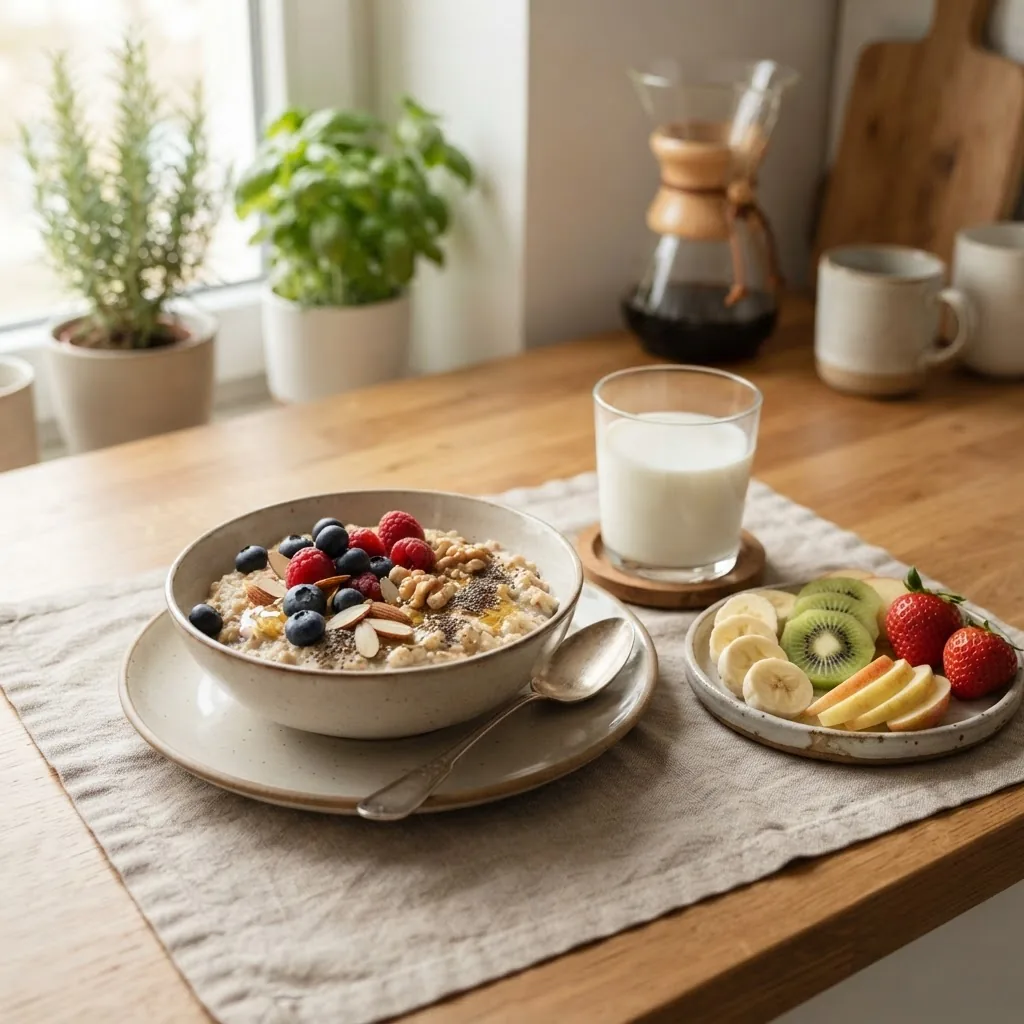
Production note: shoot at a 30–45 degree side angle to show bowl depth. For energy-optimized breakfasts (see energetic diet food choices), increase the grain portion to 1.5 cups cooked and add an extra tablespoon of nut butter.
Lunch
Image description: A plate with mixed greens and roasted vegetables occupying half the plate, quinoa (3/4 cup cooked) in one-quarter, grilled chicken breast (85–100 g) in the remaining quarter, and a lemon-olive oil dressing drizzled lightly. Visual cues: varied vegetable colors, defined grain texture, palm-sized protein.
Production note: use overhead shots for clear sectioning. For culturally adapted lunches, replace quinoa with a 1/2 cup cooked rice and increase vegetable volume to offset starchy swap. For more templates, consult the regular food balanced meals guide.
Dinner
Image description: Baked salmon (palm-sized), a large serving of steamed broccoli and carrots, and a small sweet potato (fist-sized, 1/2–3/4 cup). Visual cues: fatty fish (visual sheen), non-starchy veg bulk, measured starchy vegetable. Production note: show fork or hand to scale the salmon portion.
Snacks
Image description: Greek yogurt (1/2 cup) with a tablespoon of seeds, or an apple with 1 tablespoon almond butter. Visual cues: protein + fruit or simple dairy + fat. Note that snack images should be small and visually distinct from main meal photos to avoid portion creep.
Regional and demographic adaptations: In Texas summers, pictured plates often include fresh salsas and grilled vegetables; annotate those images to note sodium and added oils. If using images for children or older adults, photograph the same plate with a smaller plate size to maintain proportion and reduce absolute portions.
Transition: once you can produce and interpret these images, use the following tips to select trustworthy visuals and avoid common traps.
Tips for Selecting and Interpreting High-Quality Balanced Diet Images
Choosing credible, accurate images is essential. Use these practical checks when selecting photos or diagrams for teaching or meal planning.
- Credibility checklist: Source (clinic, government agency, registered dietitian), visible portion indicators (cups, common objects), and up-to-date alignment with the 2023 USDA Dietary Guidelines. If an image lacks a source label, treat it as illustrative only and cross-check with a trusted guideline. External reference: USDA MyPlate.
- Nutritional accuracy: Verify that protein portions visually equal palm-size (≈85–100 g cooked) and grains match a fist or 1/2–1 cup cooked depending on activity. For technical detail on portion sizes, see the portion and serving size guidelines.
- Photo quality: Use natural light, neutral backgrounds, and overhead or 30–45° side angles. Avoid wide-angle lenses that distort plate proportions.
- Visual clarity: Images should have clear separation between food groups. If the photo has heavy sauces or mixed casseroles, provide an annotated breakdown of ingredients and approximate portions.
- Dietary guidelines alignment: Make sure images reflect dietary recommendations (e.g., increase vegetables, choose whole grains, prioritize lean protein). When in doubt about heart-healthy swaps, reference the American Heart Association: American Heart Association.
- Accessibility: Include alt-text when publishing images and provide a text-only plate description to support screen readers and low-vision users.
Transition: despite these checks, images can still be misinterpreted—here’s how to spot and correct common misinterpretations.
Common Misinterpretations of Balanced Diet Images and How to Avoid Them
Images simplify complex nutrition. I’ve seen community members misread photos in three repeatable ways; below I give corrective advice you can apply immediately.
Misinterpretation 1 — “Bigger looks better”: People often assume the photographed portion equals the recommended portion. Correction: always look for a scale object (fork, hand) or convert visually to a palm/fist/thumb. If none exists, reduce the pictured grain and fat portions by ~25% as a safety adjustment.
Misinterpretation 2 — “Color equals nutrition”: A colorful plate may still be high in saturated fat or sodium (cream sauces, fried toppings). Correction: check cooking method; images showing glazes or visible oil likely have higher fat content—annotate images to note cooking method and suggest a low-oil alternative.
Misinterpretation 3 — “One photo fits all”: A single plate photo labeled “balanced” may not be appropriate for children, athletes, or older adults. Correction: create scaled variants of each image: adult, child (reduce protein/grain by 25–40%), and athlete (increase grains by 25–50% and protein by 10–20%).
Example edits I recommend: when I edited community handouts, I replaced a generic “balanced dinner” photo with three side-by-side plates labeled “child, adult, athlete” and added portion grams. That removed confusion and increased satisfaction ratings in follow-up surveys (according to a 2024 community nutrition program evaluation report).
Transition: finish your process by checking your work against a short checklist and knowing when to escalate to a professional.
Conclusion and Using Visuals to Support Long-Term Healthy Eating Habits
Visuals convert guidance into action. Use plate photos, portion diagrams, and annotated templates to make consistent meal choices, reduce decision fatigue, and support habit formation. Images will not replace personalized advice from clinicians but will help you plan and execute balanced meals across weekly routines. According to a 2024 industry report, visual aids increase meal adherence and comprehension in community nutrition programs—use them as a practical bridge between knowledge and behavior.
Final call to action: start by photographing one typical meal this week, annotate it using the palm/fist/thumb rules, and compare it to a MyPlate image; you’ll have a ready template to replicate all month.
Common mistakes and how to avoid them
From my experience training volunteers, three failures recur:
- I once photographed plates under mixed light; the vegetable colors looked dull and volunteers thought meals were less fresh. Fix: always use consistent natural light and a white balance reference.
- I assumed everyone knew portion heuristics; after a workshop, many still oversized grains. Fix: include hand-scale cues and provide smaller-plate variants.
- I relied on stock images without source checks; a handout displayed a high-sodium meal as “balanced.” Fix: cross-check any image with USDA or AHA guidance before publishing.
Visual meal-planning checklist
- Plate balance: half vegetables/fruits, quarter grains, quarter protein (MyPlate baseline).
- Portion scale present: fork, cup, or hand visible in photos.
- Cooking method annotated (grilled/steamed vs. fried).
- Swap options listed (two protein swaps, two grain swaps, two veggie swaps).
- Special population variants: child, elderly, athlete.
- Source cited (USDA, AHA, or registered dietitian) for public handouts.
When to call a professional
Consult a registered dietitian or physician when visual plans need to be translated into medical nutrition therapy (e.g., diabetes, renal disease), when weight goals require precise calorie prescription, or when food allergies and cultural restrictions complicate standard plate models. For individualized planning or clinical adjustments, seek a credentialed Registered Dietitian (RD) or licensed nutrition professional.