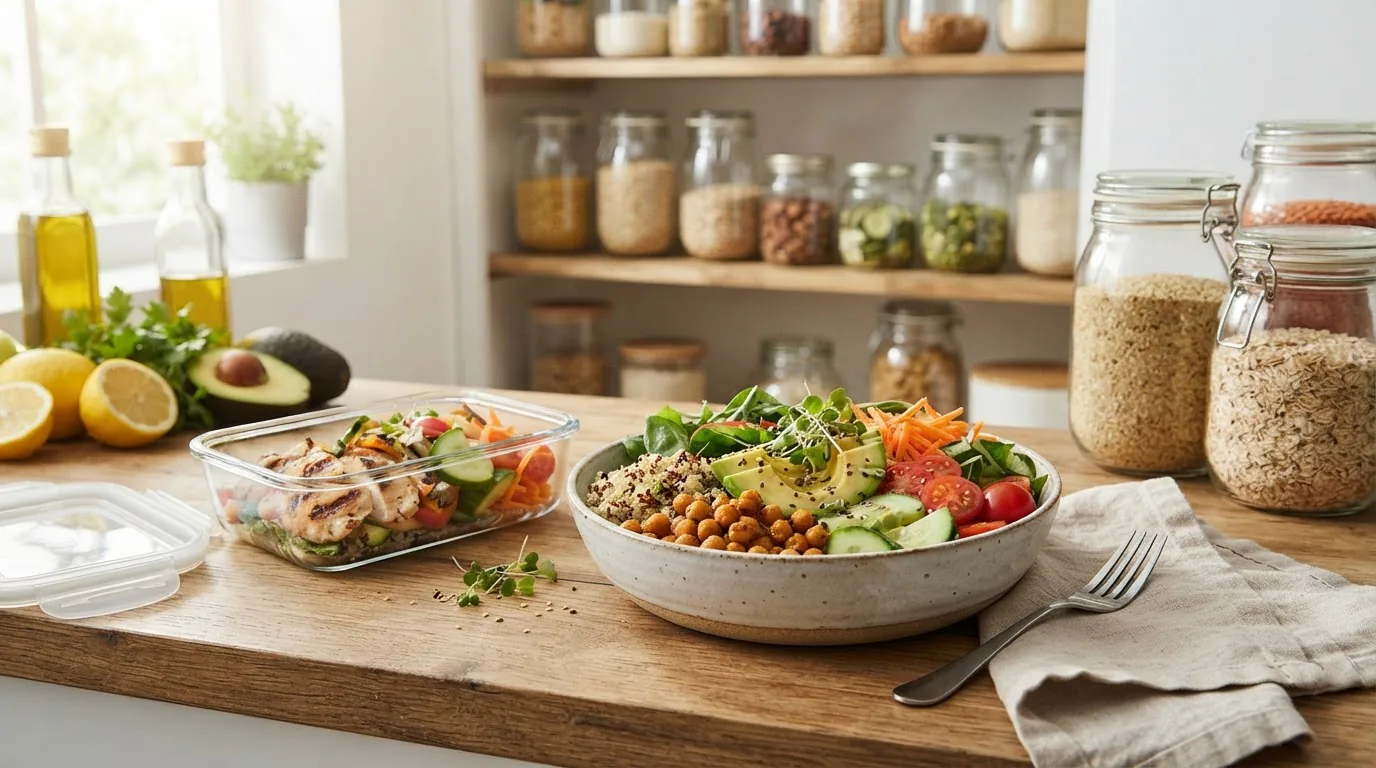
healthy food vitamin chart — use this guide to quickly find which fruits and vegetables supply the vitamins your body needs and how much to target daily. This article explains the most important vitamins and minerals found in produce, provides detailed charts for easy reference, and shows practical ways to meet Recommended Dietary Allowances through whole foods.
Introduction to Vitamins in Healthy Foods
Vitamins are small molecules that act as essential cofactors and signals for the body’s metabolic processes. From immune support (vitamin C) to vision and cell differentiation (vitamin A), fruits and vegetables are foundational natural sources of many vitamins and allied micronutrients. This section summarizes what to expect from a produce-focused vitamin reference and links vitamin intake to a varied diet.
Produce offers a spectrum of micronutrients: carotenoids in orange vegetables, vitamin C in citrus and berries, folate in leafy greens, and vitamin K-rich collards and kale. Although plant foods are poor sources of vitamin D, they provide many co-factors and antioxidants that improve overall nutrient status and health outcomes.
Nutrition planning using a food vitamin chart helps identify targeted foods to meet needs without over-relying on supplements. For more context on how vitamin intake fits within broader dietary recommendations, consult a varied diet guide and requirements review.
varied diet guide and requirements
diet definition guide and requirements
Transitioning to the next section, we’ll define the intake standards you’ll use to interpret vitamin quantities in the charts below.
Understanding Vitamin Requirements and Dietary Reference Intakes
To interpret a vitamin chart, you need clear reference points. The primary standards used in the United States are the Recommended Dietary Allowance (RDA), Dietary Reference Intakes (DRIs), and Daily Values (DVs) used on food labels. These values vary by age, sex, life stage (pregnancy/lactation), and health status.
- RDA: Average daily intake level sufficient to meet the needs of nearly all (97–98%) healthy individuals in a specific life-stage and sex group.
- DRI: A broader set of reference values (including RDA, Adequate Intake, Tolerable Upper Intake Level) used for planning and assessing diets.
- Daily Values (DV): Simplified percentage used on nutrition labels for general public guidance; often based on 2,000 calorie reference.
Key points and stat block for quick use:
- Adult RDA examples (typical adult male/female): vitamin C 90/75 mg, vitamin A 900/700 µg RAE, folate 400 µg DFE, vitamin B6 1.3–1.7 mg. (According to a 2024 NIH report summarizing DRIs.)
- Vitamin D: 600–800 IU for most adults; many people need sunlight exposure or fortified foods. (According to a 2024 NIH ODS factsheet.)
- Vitamin K: Adequate Intake ~120 µg for adult males, 90 µg for adult females. (According to a 2024 NIH factsheet.)
- Minerals like potassium: recommended ~2,600–3,400 mg/day depending on sex and age. (According to a 2024 USDA summary.)
Note: RDAs and DRIs update periodically. For the latest tables, consult the USDA nutrient databases and NIH Office of Dietary Supplements.
External authoritative references:
- NIH Office of Dietary Supplements — individual vitamin and mineral factsheets.
- USDA FoodData Central — nutrient composition database used to compile chart values.
- CDC Nutrition — public-health context for deficiencies and dietary patterns.
Transition: with intake standards set, the next section presents the main product — a detailed vitamin chart focused on fruits and vegetables.
Healthy Food Vitamin Chart: Vitamins in Fruits and Vegetables
Below is a detailed reference table showing typical vitamin content per common serving of fruits and vegetables. Values are approximate averages based on the 2024 USDA nutrient database and are intended as practical guidance for meal planning.
Key to table: Serving sizes are standard (1 cup raw, 1 medium piece, or ½ cup cooked unless noted). Percent DV columns estimate percentage of daily needs for a general adult (2,000 kcal reference) — use RDAs/DRIs for precise, age- and sex-specific planning.
| Food (serving) | Vitamin A (µg RAE / %DV) | Vitamin C (mg / %DV) | Vitamin E (mg / %DV) | Vitamin K (µg / %DV) | Folate (µg / %DV) | Vitamin B6 (mg / %DV) | Notes (vitamin D) |
|---|---|---|---|---|---|---|---|
| Spinach, raw (1 cup) | 281 µg (31% DV) | 8.4 mg (9% DV) | 0.6 mg (4% DV) | 145 µg (121% DV) | 58 µg (15% DV) | 0.2 mg (12% DV) | Negligible |
| Kale, raw (1 cup) | 103 µg (11% DV) | 80 mg (89% DV) | 1.5 mg (10% DV) | 547 µg (456% DV) | 19 µg (5% DV) | 0.1 mg (6% DV) | Negligible |
| Carrot, raw (1 medium) | 509 µg (57% DV) | 5.9 mg (7% DV) | 0.7 mg (5% DV) | 8 µg (7% DV) | 19 µg (5% DV) | 0.1 mg (6% DV) | Negligible |
| Sweet potato, baked (1 medium) | 1069 µg (119% DV) | 22.3 mg (25% DV) | 0.3 mg (2% DV) | 3.3 µg (3% DV) | 11 µg (3% DV) | 0.3 mg (18% DV) | Negligible |
| Broccoli, cooked (½ cup) | 31 µg (3% DV) | 51 mg (57% DV) | 0.6 mg (4% DV) | 92 µg (77% DV) | 57 µg (14% DV) | 0.2 mg (12% DV) | Negligible |
| Red bell pepper, raw (1 medium) | 157 µg (17% DV) | 152 mg (169% DV) | 1.6 mg (11% DV) | 6 µg (5% DV) | 27 µg (7% DV) | 0.3 mg (18% DV) | Negligible |
| Orange, medium | 12 µg (1% DV) | 70 mg (78% DV) | 0.2 mg (1% DV) | 0 µg (0% DV) | 40 µg (10% DV) | 0.1 mg (6% DV) | Negligible |
| Strawberries (1 cup, halved) | 1 µg (0% DV) | 89 mg (99% DV) | 0.5 mg (3% DV) | 3 µg (3% DV) | 40 µg (10% DV) | 0.1 mg (6% DV) | Negligible |
| Blueberries (1 cup) | 9 µg (1% DV) | 14 mg (16% DV) | 0.8 mg (5% DV) | 29 µg (24% DV) | 9 µg (2% DV) | 0.1 mg (6% DV) | Negligible |
| Avocado (1 medium) | 14 µg (2% DV) | 12 mg (13% DV) | 2.7 mg (18% DV) | 21 µg (18% DV) | 90 µg (23% DV) | 0.4 mg (24% DV) | Negligible |
| Tomato (1 medium) | 16 µg (2% DV) | 16 mg (18% DV) | 0.5 mg (3% DV) | 7 µg (6% DV) | 18 µg (5% DV) | 0.1 mg (6% DV) | Negligible |
| Banana (1 medium) | 3 µg (0% DV) | 10 mg (11% DV) | 0.1 mg (1% DV) | 0.6 µg (1% DV) | 24 µg (6% DV) | 0.4 mg (24% DV) | Negligible |
Notes on interpreting the table:
- Percent DVs are approximate and based on general adult needs — for pregnancy, children, elderly, and specific medical conditions, consult age- and sex-specific RDA/DRI tables.
- Vitamin D is mostly absent in fruits and vegetables; sunlight exposure and fortified foods are primary sources.
- Values reflect typical raw or cooked forms and will vary by variety, ripeness, soil, and preparation.
balanced diet images guide and printable nutrition charts
Transition: next, we’ll break out key antioxidant vitamins A, C, and E with food examples and interpretation tips.
Vitamin A, C, and E Content in Fruits and Vegetables
These antioxidant vitamins play overlapping roles: vitamin A (and provitamin A carotenoids) supports vision and cell growth, vitamin C aids immune function and iron absorption, and vitamin E protects cell membranes from oxidative damage.
| Food | Vitamin A (µg RAE) | Vitamin C (mg) | Vitamin E (mg) | Why it matters |
|---|---|---|---|---|
| Sweet potato (1 medium) | 1069 | 22 | 0.3 | High beta-carotene → strong vitamin A source for eye health. |
| Red bell pepper (1 medium) | 157 | 152 | 1.6 | Exceptional vitamin C per calorie; boosts iron absorption from plants. |
| Carrot (1 medium) | 509 | 6 | 0.7 | Beta-carotene rich; ideal for vision and skin health. |
| Spinach (1 cup) | 281 | 8 | 0.6 | Good mixed profile — vitamin K and folate also present. |
| Avocado (1 medium) | 14 | 12 | 2.7 | One of the better plant sources of vitamin E and healthy fats for absorption. |
Interpretation tips:
- Beta-carotene in orange produce is converted to vitamin A (measured in µg RAE); conversion efficiency varies by individual and fat intake.
- Vitamin C is water-soluble and heat-sensitive — raw or lightly cooked fruits/vegetables preserve more.
- Vitamin E is fat-soluble; pairing vitamin E-rich plants (avocado, spinach) with a small healthy fat improves absorption.
Transition: now turn to the B-complex group, which supports energy metabolism and cell division, with plant-based examples.
B Vitamins and Their Sources in Vegetables
The B complex vitamins include several water-soluble vitamins important for energy metabolism and red blood cell formation. Folate (B9) is particularly abundant in leafy greens; B6 and B1 are available in varied plant foods.
| Food | Folate (µg DFE) | Vitamin B6 (mg) | Thiamin B1 (mg) | Why it matters |
|---|---|---|---|---|
| Spinach (1 cup) | 58 | 0.2 | 0.1 | Excellent folate source; useful for pregnancy and cell division. |
| Avocado (1 medium) | 90 | 0.4 | 0.1 | Rich in folate and B6 — supports amino acid metabolism. |
| Potato, baked (1 medium) | 42 | 0.4 | 0.16 | Good source of B6; helps convert food into usable energy. |
| Asparagus (1 cup cooked) | 134 | 0.2 | 0.2 | High folate and a strong B-vitamin profile for cell health. |
| Green peas (½ cup cooked) | 36 | 0.2 | 0.1 | Good overall B-group support with fiber and protein. |
Practical notes:
- Folate labels may use Dietary Folate Equivalents (DFE), which account for differences between natural folate and synthetic folic acid.
- B vitamins are water-soluble and often lost in cooking water — steaming preserves more than boiling.
- If you’re pregnant or trying to conceive, prioritize leafy greens, legumes, and fortified grains for folate (and follow professional guidance on folic acid supplementation).
Transition: next, vitamin D and K — two fat-soluble vitamins with major roles in bone health and blood clotting — and how to source them from diet and sunlight.
Vitamin D and Vitamin K: Importance and Food Sources
Vitamin D and K are fat-soluble vitamins linked to bone and cardiovascular health. Vitamin K is plentiful in leafy greens; vitamin D is scarce in fruits and vegetables and often requires fortified foods or sun exposure.
| Vitamin | Primary Plant Sources | Typical Serving Value | Notes |
|---|---|---|---|
| Vitamin K | Kale, spinach, collards, broccoli | Kale (1 cup raw): ~547 µg | High in leafy greens; fat needed for absorption; interacts with anticoagulant medications. |
| Vitamin D | Fortified plant milks, fortified orange juice, UV-exposed mushrooms | Fortified milk: varies (typically 100 IU per cup); mushrooms (varies widely) | Primary sources are sun exposure and fortified foods; plant sources are limited. |
Guidance:
- Vitamin K intake from greens helps maintain bone health and assists blood clotting — most adults meet needs through leafy greens.
- Because vitamin D is rarely present in sufficient amounts in produce, consider fortified foods or brief safe sun exposure; supplementation may be necessary for those at risk of deficiency. (According to a 2023 NIH report on vitamin D status.)
Transition: the next section complements vitamin charts with a minerals chart focused on calcium, iron, magnesium, potassium, and zinc in fruits and vegetables.
Minerals in Fruits and Vegetables: A Companion Nutritive Chart
Minerals are inorganic elements required for structural and regulatory functions: calcium for bone, iron for oxygen transport, magnesium for enzyme activity, potassium for fluid balance and blood pressure regulation, and zinc for immunity and DNA repair.
| Food (serving) | Calcium (mg / %DV) | Iron (mg / %DV) | Magnesium (mg / %DV) | Potassium (mg / %DV) | Zinc (mg / %DV) |
|---|---|---|---|---|---|
| Spinach (1 cup raw) | 30 mg (3% DV) | 0.8 mg (4% DV) | 24 mg (6% DV) | 167 mg (4% DV) | 0.5 mg (5% DV) |
| Kale (1 cup raw) | 90 mg (9% DV) | 1.1 mg (6% DV) | 18 mg (4% DV) | 329 mg (7% DV) | 0.4 mg (4% DV) |
| Broccoli (½ cup cooked) | 21 mg (2% DV) | 0.4 mg (2% DV) | 12 mg (3% DV) | 230 mg (5% DV) | 0.3 mg (3% DV) |
| Banana (1 medium) | 6 mg (1% DV) | 0.3 mg (2% DV) | 32 mg (8% DV) | 422 mg (9% DV) | 0.2 mg (2% DV) |
| Sweet potato (1 medium) | 39 mg (4% DV) | 1 mg (6% DV) | 33 mg (8% DV) | 438 mg (9% DV) | 0.3 mg (3% DV) |
| Edamame (½ cup cooked) | 63 mg (6% DV) | 2.3 mg (13% DV) | 50 mg (12% DV) | 436 mg (9% DV) | 0.9 mg (8% DV) |
Short descriptions per mineral:
- Calcium: Most abundant mineral in bone. Plant sources include kale, bok choy, and fortified plant milks. Absorption depends on oxalate content (higher in spinach — reduces bioavailable calcium).
- Iron: Non-heme iron in plants has lower bioavailability than heme iron. Pair with vitamin C-rich foods to enhance absorption.
- Magnesium: Found in leafy greens, legumes, nuts, and whole grains; important for energy reactions and muscle function.
- Potassium: Abundant in bananas, potatoes, avocados, and spinach; important for blood pressure regulation.
- Zinc: Present in legumes, seeds, and some vegetables; bioavailability is reduced by phytates but can be improved by soaking/fermenting.
Transition: now we’ll cover practical steps for using vitamin charts in meal planning with real examples and worksheets.
How to Use a Healthy Food Vitamin Chart in Meal Planning
Using a vitamin chart effectively means translating nutrient numbers into daily food choices. Below are clear, numbered steps and case-study examples showing how to reach RDAs for common vitamins using fruits and vegetables.
- Set your targets. Determine the relevant RDA/DRI for your age and sex. For basic adult planning, use the standard RDA/DRI charts (see the balanced nutrition guide and meal requirements for health for overall meal context).
- Identify nutrient-dense produce. Use the vitamin chart to select high sources (e.g., kale for vitamin K, red bell pepper for vitamin C, sweet potato for vitamin A).
- Combine foods to enhance bioavailability. For iron, pair high-iron plant foods (spinach, lentils) with vitamin C-rich fruits like oranges or strawberries.
- Plan meals with distribution in mind. Spread vitamin-rich foods across meals to improve absorption and reduce cooking losses.
- Account for cooking and storage. Choose cooking methods that preserve nutrients: steaming, microwaving, and quick sautéing retain more vitamins than long boiling.
- Use fortified foods and small supplements when needed. For vitamin D and B12 (not plentiful in plants), use fortified plant milks, fortified cereals, or supplements after consulting a healthcare practitioner.
Example 1 — Meeting vitamin C RDA using produce (adult female target ~75 mg/day):
- Breakfast: ½ cup strawberries (≈45 mg)
- Snack: 1 orange (≈70 mg) — one serving alone reaches/exceeds RDA
- Lunch/dinner: add red bell pepper slices (≈50–100 mg per pepper) to salads to further support iron absorption.
Example 2 — Hitting folate and vitamin K for pregnancy planning (use RDAs specific to pregnancy):
- Breakfast: fortified cereal + orange (extra folic acid)
- Lunch: large spinach/kale salad (rich folate and vitamin K)
- Dinner: steamed asparagus (very high folate)
- Note: follow health provider guidance on supplemental folic acid dose during pregnancy.
Workflows and tools:
- Use a simple worksheet to record servings and nutrient contributions each meal. (For printable templates see the healthy diet worksheet guide and printable meal requirements.)
- If you are following a calorie-restricted plan, integrate vitamin charts into your energy targets (see the 1400 calorie meal plan guide and nutrition requirements).
- For carbohydrate-consistent plans (CCHO), align vitamin-rich vegetable choices with carb allotments (see consistent carbohydrate diet guide and requirements).
- To integrate vitamin tracking with macronutrient planning, consult the macro meal planner guide.
- For weekly menu planning that includes vitamin targets, use a meal planner printable (see meal planner printable guide and weekly menu requirements).
balanced nutrition guide and meal requirements for health
1400 calorie meal plan guide and nutrition requirements
consistent carbohydrate diet guide and requirements
healthy diet worksheet guide and printable meal requirements
macro meal planner guide
meal planner printable guide and weekly menu requirements
Case study: a day that meets common adult RDAs for vitamins (approximate):
- Breakfast: fortified whole-grain cereal + ½ cup strawberries (vitamin C, B vitamins, fortified vitamin D + calcium)
- Lunch: spinach-kale salad with red pepper, avocado, and ½ cup cooked lentils (folate, vitamin K, vitamin C, magnesium, iron)
- Snack: orange or banana (vitamin C or potassium)
- Dinner: sweet potato + mixed steamed broccoli + quinoa (vitamin A, C, fiber, complementary protein, magnesium)
For additional strategies to combine vitamin charts with calorie or macronutrient goals, see the 1400 calorie meal plan guide and nutrition requirements or the macro meal planner guide.
Transition: after planning guidance, we’ll examine common deficiencies and food-based remedies.
Common Vitamin Deficiencies and How to Avoid Them with Food Choices
Vitamin deficiencies remain clinically relevant. Common examples include iron-deficiency anemia, scurvy (vitamin C deficiency), vitamin D insufficiency, and folate deficiency in pregnancy. Public-health data show variable prevalence across populations due to diet, sun exposure, and socioeconomic factors.
Key deficiencies and food-based prevention strategies:
- Iron deficiency anemia: Signs: fatigue, pallor, shortness of breath. Prevent with iron-rich plant foods (legumes, spinach, tofu) and pair with vitamin C sources (citrus, bell peppers) to improve absorption. For severe cases, clinical iron therapy may be required. (According to a 2023 CDC summary on anemia prevalence.)
- Vitamin C deficiency (scurvy): Signs: bleeding gums, bruising, poor wound healing. Prevent with simple daily servings of citrus, strawberries, or peppers — even small amounts meet needs quickly.
- Vitamin D insufficiency: Signs: bone pain, muscle weakness. Address by safe sun exposure, fortified foods (plant milks, breakfast cereals), and supplementation if needed under medical guidance. (According to a 2023 NIH ODS review.)
- Folate deficiency: Signs: megaloblastic anemia, neural tube defect risk in pregnancy. Prevent by including leafy greens, legumes, and fortified grains; pregnant people should follow medical guidance for supplemental folic acid.
- Vitamin B12 (not abundant in plants): Risk mainly for strict vegans — prevent with fortified foods or supplements after checking serum levels.
Practical food recommendations:
- Daily: 1–2 servings of citrus or bell pepper for vitamin C; 1–2 cups of leafy greens for folate and vitamin K; 1 medium sweet potato or 1 cup carrots for vitamin A.
- Include a variety of colors: “eat the rainbow” helps cover antioxidant vitamins and phytonutrients.
- Use fortified foods selectively for nutrients low in produce (vitamin D, B12) and consult a healthcare professional before starting supplements.
Transition: the next section compares vitamin density across vegetables and fruits so you can choose the most efficient sources per calorie or serving.
Comparing Vitamin Content Across Different Vegetables and Fruits
Not all produce is equally nutrient-dense. Below are comparison tables and analysis to help prioritize foods when aiming to maximize vitamin intake per serving or per calorie.
| Food | Vitamin A (µg RAE) / Calorie | Vitamin C (mg) / Calorie | Folate (µg) / Calorie | Vitamin K (µg) / Calorie |
|---|---|---|---|---|
| Kale (1 cup raw, 33 kcal) | 103 µg (3.1 µg/kcal) | 80 mg (2.4 mg/kcal) | 19 µg (0.58 µg/kcal) | 547 µg (16.6 µg/kcal) |
| Red bell pepper (1 medium, 31 kcal) | 157 µg (5.1 µg/kcal) | 152 mg (4.9 mg/kcal) | 27 µg (0.87 µg/kcal) | 6 µg (0.19 µg/kcal) |
| Sweet potato (1 medium, 112 kcal) | 1069 µg (9.6 µg/kcal) | 22 mg (0.20 mg/kcal) | 11 µg (0.10 µg/kcal) | 3.3 µg (0.03 µg/kcal) |
| Strawberries (1 cup, 49 kcal) | 1 µg (0.02 µg/kcal) | 89 mg (1.8 mg/kcal) | 40 µg (0.82 µg/kcal) | 3 µg (0.06 µg/kcal) |
Analysis:
- Per-calorie, leafy greens and red bell peppers offer exceptional vitamin C and K density. Sweet potato supplies a very high vitamin A yield per calorie.
- If you’re calorie-restricted (e.g., following a 1400 kcal plan), focus on high nutrient-per-calorie foods: kale, spinach, peppers, berries, and sweet potatoes. (See the 1400 calorie meal plan guide and nutrition requirements for integration tips.)
- For those prioritizing potassium and magnesium per serving, choose bananas, potatoes, avocados, and cooked beans.
1400 calorie meal plan guide and nutrition requirements
Transition: while charts provide numbers, limitations and real-world considerations affect how you use them.
Limitations and Considerations When Using Vitamin Charts
Vitamin charts are guides, not absolute statements. Several important limitations affect their use:
- Bioavailability: The portion of a nutrient that is absorbed and used by the body varies. For example, non-heme iron from plants has lower absorption than heme iron and is inhibited by phytates and polyphenols but enhanced by vitamin C intake.
- Food variability: Soil quality, ripeness, storage, and plant variety change nutrient composition. Values in the USDA database are averages. (According to a 2024 USDA nutrient database summary.)
- Processing effects: Canning, juicing, and long cooking reduce some vitamins (notably vitamin C and some B vitamins).
- Interactions with medications: Vitamin K intake can affect anticoagulant medications; always coordinate dietary changes with your healthcare provider.
- Individual needs: Age, pregnancy, chronic conditions, gastrointestinal disorders, and absorption issues alter requirements and effective intake.
Trust and safety notes:
- Vitamin charts should be used alongside clinical advice when treating deficiencies or managing chronic conditions.
- Supplements can help fill gaps but carry risks if taken in excess — avoid exceeding Tolerable Upper Intake Levels without supervision.
- For the most accurate, up-to-date nutrient data, consult the USDA FoodData Central and NIH ODS factsheets linked above.
Transition: final section summarizes practical next steps and encourages action using the charts.
Conclusion and Next Steps for Balanced Vitamin Intake
Use this healthy food vitamin chart to identify high-yield fruits and vegetables for key vitamins and minerals, plan meals that distribute nutrient sources through the day, and pair foods to improve absorption. Start by setting personal targets based on RDA/DRI tables, track a week of meals using a worksheet, and adjust choices toward high nutrient-density produce like leafy greens, bell peppers, sweet potatoes, and berries.
Call to action: begin by choosing three target vitamins you want to improve (for example, vitamin D, iron, and vitamin C) and create two meals this week that include the high-source foods from the charts. For deeper meal-planning tools and printable trackers, visit the balanced nutrition guide and meal requirements for health.
balanced nutrition guide and meal requirements for health
Frequently Asked Questions
What is a healthy food vitamin chart and how is it used?
A healthy food vitamin chart lists vitamin amounts in common fruits and vegetables per serving to help you choose foods that meet RDAs/DRIs; use it to plan meals, pair foods for better absorption, and prioritize nutrient-dense produce for daily targets.
How do vitamins in fruits compare with vitamins in vegetables?
Fruits often provide higher vitamin C and certain antioxidants, while vegetables—especially leafy greens and orange vegetables—tend to offer more vitamin K, folate, and provitamin A; both complement each other for a balanced vitamin profile.
Which fruits and vegetables have the highest vitamin C content?
Top vitamin C producers include red bell peppers, strawberries, oranges, kiwi, and kale; red bell pepper and strawberries deliver particularly high vitamin C per serving and per calorie, boosting iron absorption when paired with plant-based iron sources.
How can I use a vitamin chart to plan balanced meals?
Identify your target RDAs, pick high-source produce for those vitamins, distribute servings across meals, and combine enhancers (e.g., vitamin C with iron-rich plants); track servings with a worksheet to ensure weekly coverage of micronutrient needs.
How long does it take to correct a vitamin deficiency through diet?
Correction time varies: vitamin C levels can improve in days to weeks with sufficient intake; iron-deficiency anemia may take several months of consistent iron-rich eating and absorption strategies; follow clinical monitoring for specifics.
What are common mistakes when relying on vitamin charts?
Common errors include ignoring bioavailability (e.g., plant iron vs heme iron), assuming fixed nutrient content despite variability, and relying solely on charts without considering medication interactions, life stage needs, or fortified sources for nutrients like vitamin D and B12.
Are vitamins in food absorbed better than those in supplements?
Many vitamins from whole foods are absorbed efficiently and come with cofactors that enhance use; however, supplements can be necessary for vitamin D or B12 in some cases; absorption varies by nutrient, form, and individual health status.
How can I ensure the quality and accuracy of vitamin information in charts?
Use reputable sources such as the USDA FoodData Central and NIH Office of Dietary Supplements for data, check publication dates (e.g., 2024 USDA database updates), and treat chart values as averages that may vary with variety, ripeness, and preparation.