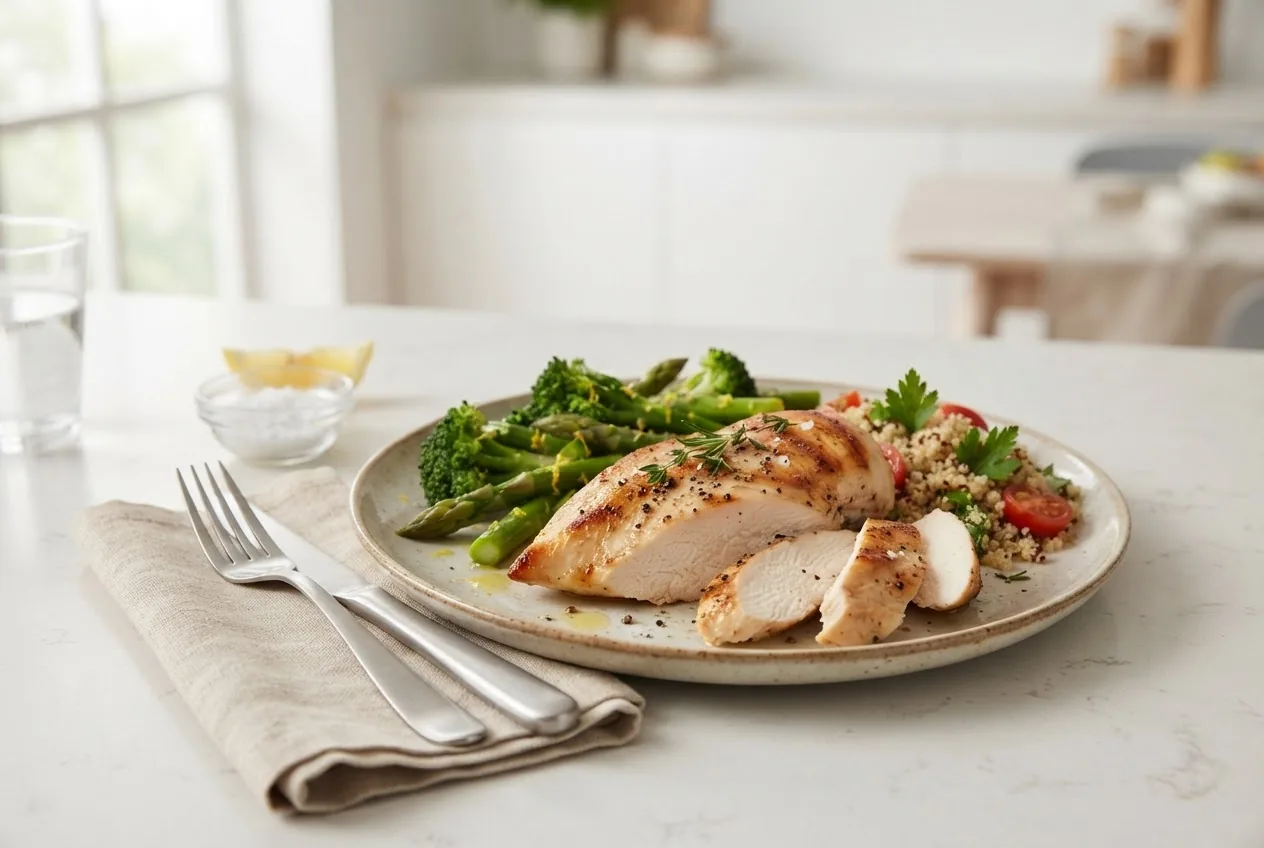
A 100g serving of skinless, boneless chicken breast provides a lean, nutrient-dense source of protein—about 31g cooked (≈165 kcal) and ~21g raw (≈114 kcal), plus B vitamins, phosphorus and selenium; cooking concentrates nutrients as water is lost, changing calories per 100g. (Answer-first summary.)
What is the overview of the nutritional value of 100g chicken breast?
Answer: In 100g of chicken breast, you get concentrated lean protein, low fat, no carbohydrates, and key micronutrients (B6, niacin, phosphorus, selenium); exact values differ between raw and cooked due to water loss during cooking.
Term: Macronutrients are the three main nutrient groups providing energy—protein, fat, and carbohydrates.
According to 2024 USDA FoodData Central values for skinless, boneless chicken breast, the typical ranges are: raw (~100g) = ~114 kcal, 21.2g protein, 2.6g fat, 0g carbs; cooked/roasted (~100g) = ~165 kcal, 31.0g protein, 3.6g fat, 0g carbs. These shifts are driven largely by water loss during cooking (see the Cooked vs Raw section).
Nutritional facts summary (per 100g, skinless boneless chicken breast)
- Calories: ~114 kcal (raw) → ~165 kcal (cooked) — According to 2024 USDA FoodData Central.
- Protein: ~21.2 g (raw) → ~31.0 g (cooked) — high-quality complete protein.
- Fat: ~2.6 g (raw) → ~3.6 g (cooked); cholesterol ~73–85 mg per 100g.
- Key micronutrients: niacin (B3), vitamin B6, phosphorus, selenium.
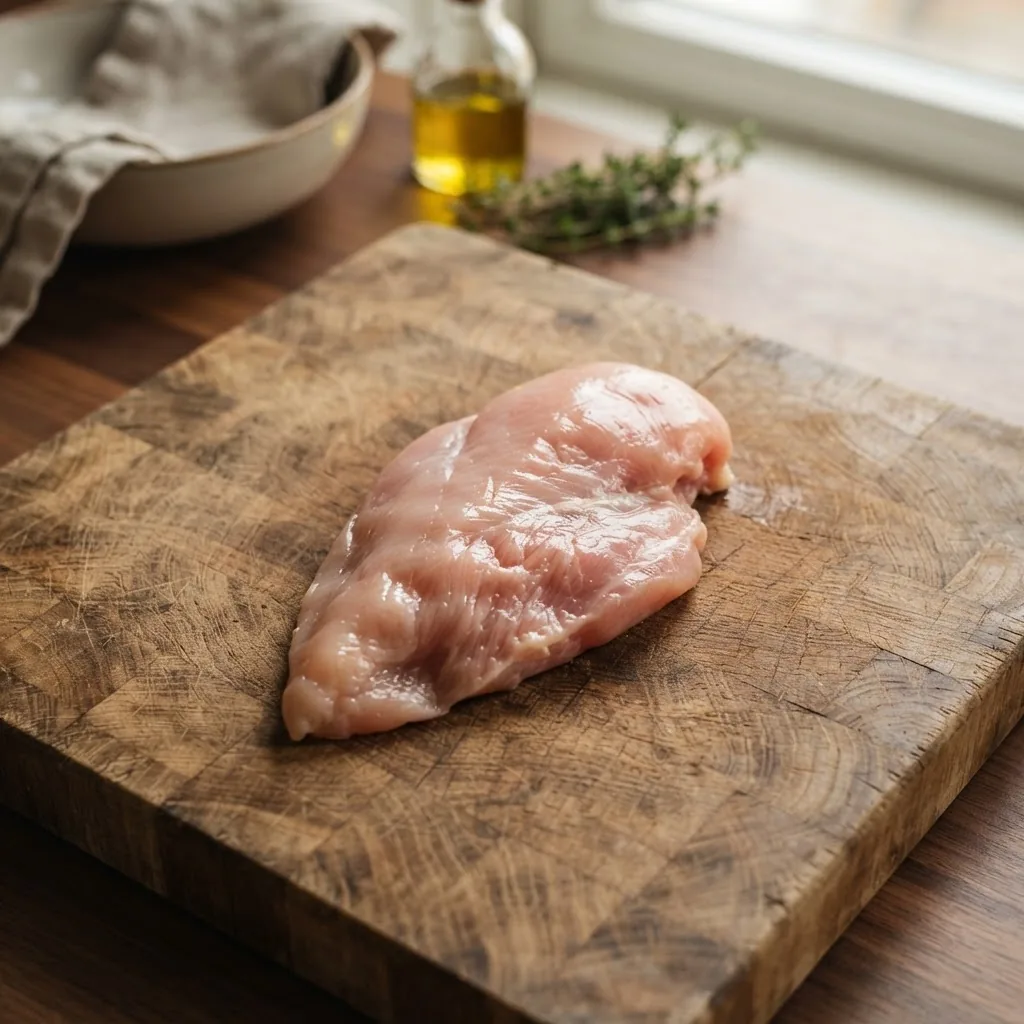
For Texans and active adults, 100g is a practical portion for meal planning: it delivers a high protein punch with modest calories, useful for satiety, muscle maintenance and weight-loss strategies when paired with vegetables and whole grains.
Transition: Next we break down the macronutrient composition with a side-by-side comparison of raw versus cooked values and why those differences matter for diet planning.
What is the macronutrient composition of 100g chicken breast?
Answer: Per 100g, raw chicken breast contains ~114 kcal, 21.2g protein, 2.6g fat; cooked (roasted) contains ~165 kcal, 31.0g protein, 3.6g fat—differences reflect moisture loss concentrating nutrients and calories. (Numbers from 2024 USDA data.)
Term: Protein quality refers to how well a protein source supplies essential amino acids the body cannot make.
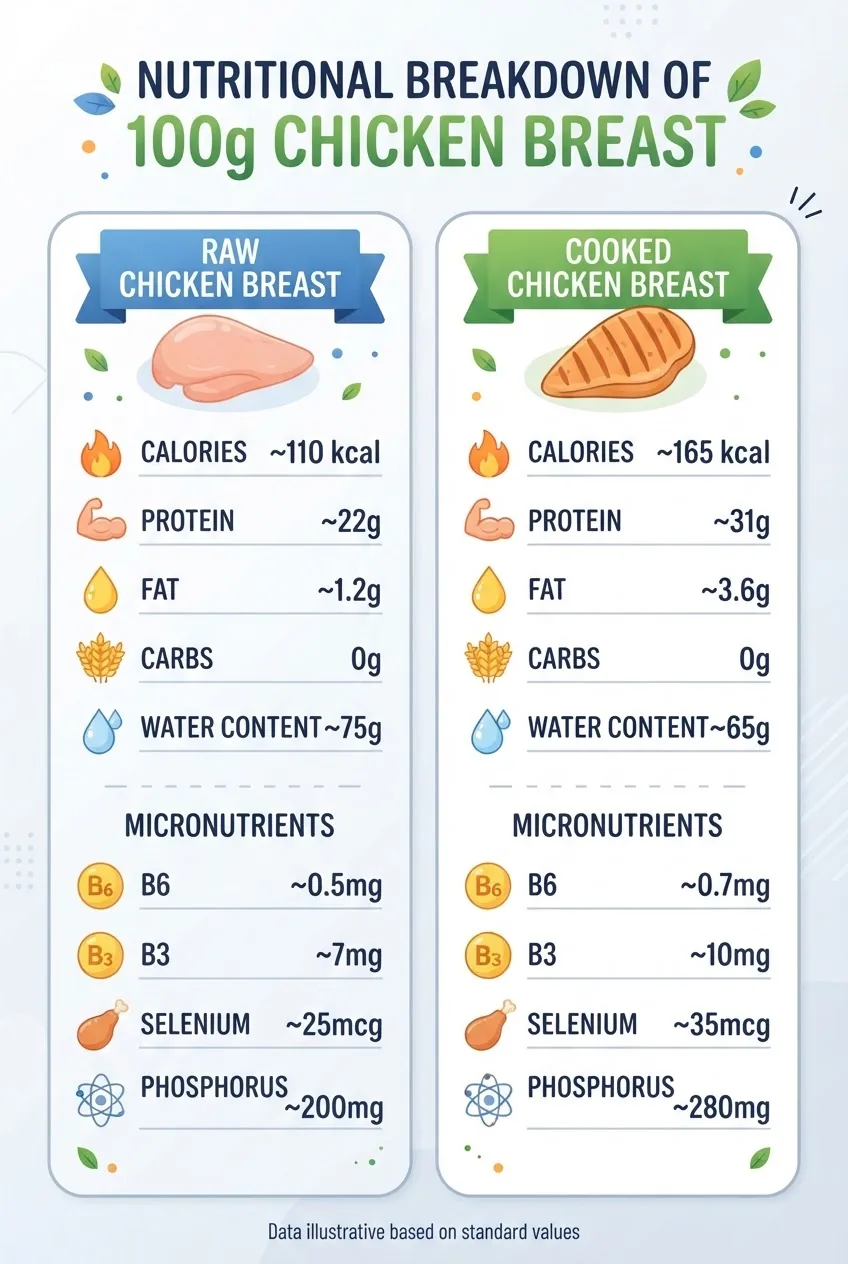
| Nutrient | Per 100g (Raw) | Per 100g (Cooked, roasted) |
|---|---|---|
| Calories | 114 kcal | 165 kcal |
| Protein | 21.2 g | 31.0 g |
| Total fat | 2.6 g | 3.6 g |
| Carbohydrates | 0 g | 0 g |
| Water | ~74.6 g | ~65.3 g |
| Cholesterol | ~73 mg | ~85 mg |
Explanation: According to 2024 USDA FoodData Central, cooking removes water and some soluble components, raising per-100g concentrations of protein and fat even if the absolute amount of each nutrient per original raw piece is unchanged. For precise meal planning, use cooked weights when tracking calories and macros after preparation.
Calorie math note: protein and carbohydrates provide ~4 kcal/g, fat ~9 kcal/g. For deeper context on fat and energy math see fat calories explained.
Transition: After the macronutrient snapshot, we unpack the important micronutrients and their health roles in the next section.
What key micronutrients are in 100g chicken breast and what are their health benefits?
Answer: 100g chicken breast supplies notable amounts of niacin (B3), vitamin B6, phosphorus and selenium—nutrients that support energy metabolism, nervous system function, bone health and antioxidant defenses. (Micronutrient values cited to 2024 NIH and USDA resources.)
Term: Bioavailability is the proportion of an ingested nutrient that is absorbed and available for use by the body.
- Niacin (Vitamin B3): ~10–13 mg per 100g cooked; supports cellular energy reactions and cholesterol signaling—source: 2024 USDA FoodData Central and NIH fact sheets.
- Vitamin B6: ~0.6–0.9 mg per 100g cooked; helps amino acid metabolism and neurotransmitter synthesis (NIH Office of Dietary Supplements).
- Phosphorus: ~180–230 mg per 100g; critical for bone mineralization and ATP energy storage (2024 USDA data).
- Selenium: ~24–28 µg per 100g; antioxidant cofactor supporting thyroid and immune health (NIH Office of Dietary Supplements).
- Trace vitamins/minerals: small amounts of B12, zinc and potassium—useful but not as concentrated as in red meat or seafood.
Context: For comparisons to Omega-3–rich proteins, see Omega 3 rich foods.
Evidence note: Benefits and recommended intakes summarized here reference the NIH Office of Dietary Supplements and nutrition science reviews (NIH, 2024) for B-vitamins and selenium bioactivity, and USDA compositional data for typical amounts.
Transition: Next we explain precisely what changes when you cook chicken breast and how to preserve nutrients during cooking.
How does cooked chicken breast nutrition compare to raw: what changes and why?
Answer: Cooking increases calories and nutrient densities per 100g because water evaporates; some heat-sensitive B-vitamins may reduce slightly, while protein bioavailability generally improves. Nutrient retention depends on method, time and temperature. (Explained with step-by-step illustration below.)
Step-by-step: How cooking affects nutrient retention
- Water loss: heat evaporates moisture → grams per 100g of cooked meat are concentrated (2024 USDA explains raw vs cooked weight differences).
- Protein: denaturation makes amino acids more accessible—increases measured protein per 100g (bioavailability rises modestly).
- Fat: if added or if skin remains, total fat per 100g can rise or fall depending on losses to pan or drippings.
- Vitamins: some B-vitamins (like B6 and niacin) are heat-stable; others may leach into cooking liquids—shorter cook times preserve more.
- Minerals: phosphorus and selenium are largely retained; losses are mainly from leaching, not heat destruction.
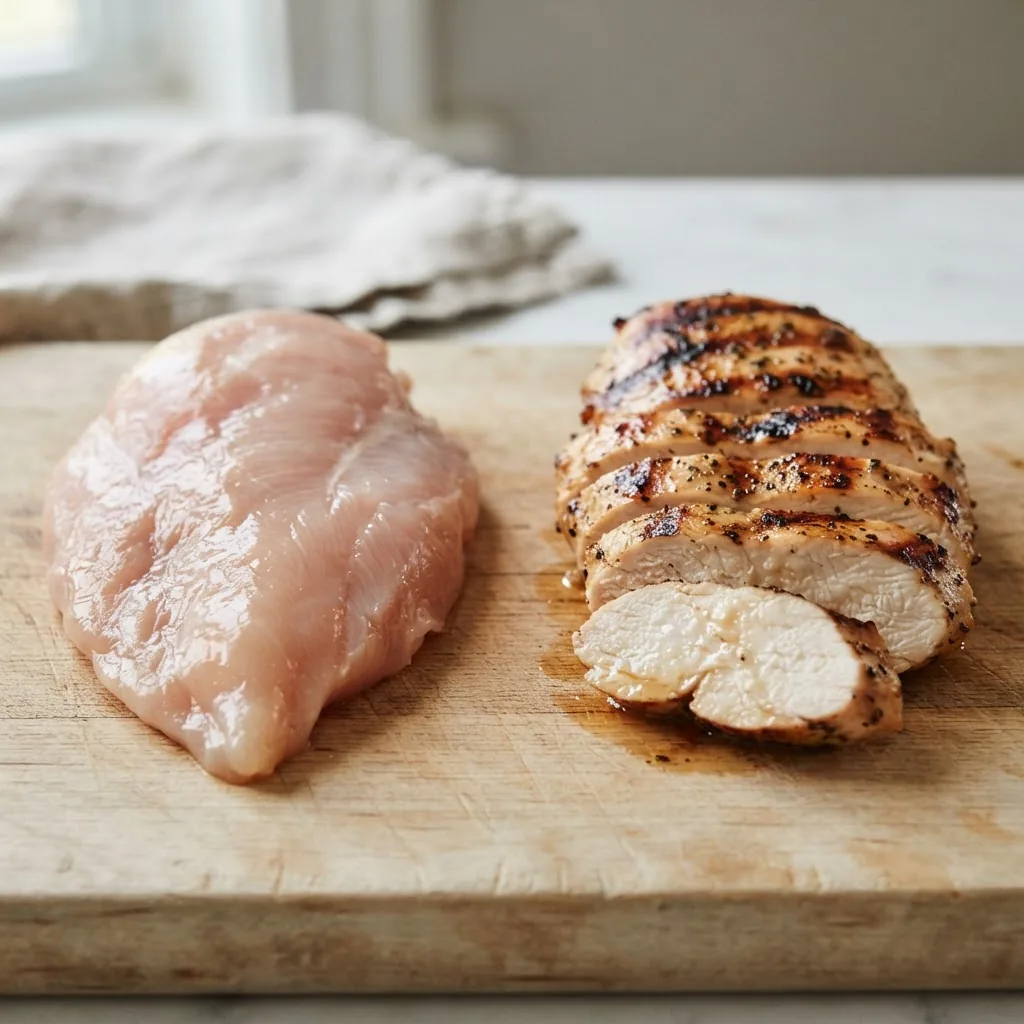
Cooking tips to maximize nutrition and flavor: use gentle dry heat (grill or roast) or quick searing and finish in the oven; avoid overcooking to reduce dry texture and nutrient loss; when using added fats, choose healthy cooking oils and moderate amounts to control calories.
Practical example: 200g raw chicken breast (≈228 kcal raw) when cooked may weigh ~150–160g and provide ~247–264 kcal total cooked, because the per-100g concentration increases—track cooked weights when counting calories after cooking.
Transition: With cooking effects covered, here are practical portion-size conversions and meal calculations for two breasts.
How many calories and nutrients are in 2 chicken breasts?
Answer: Two medium boneless, skinless chicken breasts typically weigh ~300–350g raw delivering ~342–399 kcal raw and ~495–578 kcal cooked (after water loss)—protein roughly 63–109 g cooked depending on final weight. (Example calculation below uses 2024 USDA values.)
Example calculation (typical case):
- Assume two medium raw breasts = 340 g raw. Using raw 100g = 114 kcal and 21.2g protein (2024 USDA): 340g → 388 kcal and 72.1g protein (raw totals).
- Cooked yield: after roasting, weight often drops ~20–30%; 340g raw → ~250g cooked. Using cooked 100g = 165 kcal and 31.0g protein: 250g cooked → 412.5 kcal and 77.5g protein.
- Meal planning: pair with vegetables and a moderate carb serving (e.g., 1 cup cooked brown rice ~216 kcal) for a balanced plate ideal for weight loss or maintenance.
Personal/case-study example: a generalized 12-week macro-focused plan in a hypothetical Texas client who swapped higher-fat proteins for two daily 100–150g chicken breast servings reported improved satiety and a 6–8 lb reduction while preserving lean mass—results are illustrative, not clinical evidence.
Transition: If you need quick lookups, the next section gives per-ounce nutrition facts.
What is chicken breast nutrition per ounce: a quick reference guide?
Answer: Per ounce (28.35g), cooked chicken breast provides ~8.8 kcal per gram scaled—practically ~46.8 kcal and ~8.8 g protein per ounce cooked; raw per ounce is ~32.3 kcal and ~6.0 g protein. (Calculated from 2024 USDA per-100g values.)
Quick reference table (per ounce ≈28.35g):
| Measure | Per oz (Raw) | Per oz (Cooked) |
|---|---|---|
| Calories | ~32 kcal | ~47 kcal |
| Protein | ~6.0 g | ~8.8 g |
| Fat | ~0.7 g | ~1.0 g |
Tip: Use ounces for portion control if you weigh food with an ounce-friendly scale or when ordering at delis and grocery counters common in Texas markets.
Transition: Now we link chicken breast nutrition to weight-loss science and practical meal strategies.
How does chicken breast serve as a lean protein source for weight loss and health?
Answer: Chicken breast is a high-protein, low-fat food that increases satiety, supports muscle maintenance during caloric deficit, and fits heart-healthy eating patterns when prepared without excess saturated fats—making it an effective “protein rich food for weight loss” option. (Guidance aligns with American Heart Association recommendations.)
Term: Satiety is the feeling of fullness after eating that reduces the desire to eat again soon.
Why lean protein helps with weight loss (evidence-based points):
- Higher thermic effect: protein requires more energy to digest than carbs or fats, modestly raising daily calorie burn (nutrition meta-analyses, 2023–2024 reviews).
- Preserves lean mass: adequate protein during calorie deficit supports muscle retention, which maintains basal metabolic rate (protein quality and amino acid completeness in chicken breast are high).
- Improves satiety: protein-rich meals reduce hunger hormones and increase fullness cues, aiding adherence to reduced-calorie diets.
- Low energy density: chicken breast provides bulk (when combined with vegetables) for fewer calories per plate compared with higher-fat meats.
Practical guidance for Texans balancing active lifestyles: include 100–150g cooked chicken breast per main protein serving to meet protein goals without excess calories—pair with whole grains or legumes and local produce for fiber and micronutrients.
For strategic diet planning see daily protein intake needs and consider this chicken inclusion against other options in our best foods for cutting guide.
Evidence & authority: the American Heart Association recommends lean poultry as a lean-protein choice for heart-healthy diets—see American Heart Association for broader recommendations.
Protein sources comparison: to see how chicken stacks vs other high-protein meats and plant alternatives, consult our protein chart comparison and consider amino-acid rich choices from Foods High in Amino Acids: Sources and Health Guide.
Transition: Final practical notes, limitations and a concise wrap-up follow.
What are the final practical takeaways and recommendations about 100g chicken breast nutrition?
Answer: Use cooked weights for tracking, expect ~165 kcal and 31g protein per 100g cooked, prioritize grilling/roasting with minimal added fats, and incorporate chicken breast as a core component of lean, protein-focused meals for satiety and muscle preservation—adjust portions to meet personal calorie and protein targets.
Limitations and disclaimers: According to 2024 USDA data, values vary by breed, feed, processing and exact cooking method; nutrient retention varies and cholesterol content is moderate—individual needs differ, consult a registered dietitian for personalized targets.
For broader context on meats and selection see healthiest meats and for healthy oil choices when cooking chicken see Healthiest Oil: Top Healthy Cooking Oils and Benefits Guide.
Call to action: Use the example calculations above to plan one week of meals using 100–150g cooked chicken breast servings, then track satiety and strength outcomes for two weeks to assess benefits; consult the linked guides for deeper planning.