Food pyramid food and the modern healthy plate are practical, visual systems that make balanced eating easy to understand and apply. This guide explains both frameworks, shows how much of your plate should be grains, vegetables, fruits, protein and dairy, and gives clear serving-size and meal-building steps you can use today.
Introduction to the Food Pyramid Food Guide and Healthy Plate
The healthy plate (often called MyPlate in U.S. materials) and the traditional food pyramid both map food groups to everyday eating choices so people can build balanced meals without complicated math. They share the same goal: help people meet nutrient needs while controlling portions and prioritizing whole foods. This section introduces the frameworks and connects readers to foundational resources for balanced nutrition.
Both tools are designed to translate nutritional science into an actionable visual: the food pyramid stacks food groups vertically to indicate relative proportions, while the healthy plate divides a single meal visually into sections. The combined approach answers practical questions like, “How much of my plate should be grains?” and “What does a balanced meal look like?” and makes portion-size judgments simpler at mealtime.
For readers who want the foundational theory and broader goals behind these tools, see our pillar resource: Balanced Nutrition Guide and Meal Requirements for Health. For definitions of basic terminology used in this guide (like “diet” and “dietary pattern”), consult the diet definition guide and requirements.
Transition: Next we’ll trace how the food pyramid evolved into plate-based guidance so you can see why current recommendations look like they do.
History and Evolution of the Food Pyramid and Nutrition Pyramid
The story of the food pyramid and nutrition pyramid is a progression from broad food-group messaging to meal-level, plate-based advice. Below is a concise timeline that highlights key shifts without repeating deep historical detail covered in our sibling pieces.
- 1970s–1980s: Early food guides — Many countries used simple lists and spokes-wheel diagrams to show recommended food groups and daily servings; guidance focused on variety and minimum servings per category (government reports).
- 1992: USDA Food Guide Pyramid — The U.S. introduced a triangular “food pyramid” that stacked food groups from base (grains) to top (fats & sweets). It emphasized servings per day by group (USDA publication).
- 2005–2010s: Critiques and updates — Nutrition science and consumer testing revealed the pyramid could be misread (proportions vs. servings), and attention shifted toward quality of foods within groups (peer-reviewed critiques and government reviews).
- 2011: MyPlate introduction — The USDA replaced the pyramid approach with a plate graphic dividing food into fruits, vegetables, grains, protein, and dairy to make meal-level choices clearer (MyPlate, government resource).
- 2015–2025: Dietary Guidelines integration — Updated Dietary Guidelines for Americans integrated plate-language with guidance on added sugars, saturated fats, and overall dietary patterns (USDA/DHHS guidelines, government reports).
- 2020s onward: Tools and customization — Increased emphasis on tailoring portions to age, sex, activity level and cultural preferences; digital tools and printable guides proliferated (government and academic tools).
Transition: Understanding that evolution helps explain the differences between the pyramid and plate — next we’ll compare them side-by-side to show their practical strengths and limitations.
Understanding the USDA Food Pyramid and the New Healthy Plate Model
| Feature | USDA Food Pyramid (traditional) | Healthy Plate / MyPlate (modern) |
|---|---|---|
| Visual form | Triangle stacking food groups by recommended serving counts. | Plate divided into sections for fruits, vegetables, grains, protein, plus dairy as a side. |
| Focus | Daily servings per group; relative importance inferred by size of tier. | Meal-level composition and portion proportions for a single meal. |
| Ease of use | Requires translation of servings into meals; harder for quick decisions. | Immediate visual cue for assembling one plate at mealtime. |
| Nutrient emphasis | Grouped by food categories; less direct focus on added sugars or fats. | Encourages half-plate vegetables/fruit and whole grains, suggests lean proteins and low-fat dairy. |
| Best for | Planning daily intake across meals; educational contexts. | Quick meal-building, portion control, family meals, school cafeterias. |
The USDA’s older pyramid emphasized how many servings from each group you should aim for across a day, while the healthy plate prioritizes what a single meal should look like. Both systems complement each other: the pyramid helps plan daily totals; the plate turns those totals into practical meal choices.
Key differences to remember:
- Proportion vs. servings — the plate directly expresses proportion (e.g., half the plate vegetables/fruit), while the pyramid requires converting servings into portioning across the day.
- Quality matters — current USDA guidance stresses whole grains over refined, lean proteins over processed meats, and more vegetables instead of starchy sides (2025 USDA Dietary Guidelines, government report).
- Personalization — both frameworks are starting points and must be adapted by age, pregnancy, activity level, and health conditions.
Transition: With that comparison in mind, the next section breaks down each food group so you know typical foods, portions and how they appear in both models.
Breakdown of Food Groups in the Food Pyramid and Healthy Plate
The most commonly recognized food groups across pyramid and plate models are grains, vegetables, fruits, protein foods, and dairy. Below we detail each group with typical serving examples and suggestions to choose nutrient-dense options. For readers seeking more depth on diversity within groups, see our varied diet guide and requirements.
- Grains
- Role: Primary source of energy (carbohydrates), some B vitamins, fiber when whole grains are chosen.
- Choose: Whole grains (brown rice, oats, whole wheat bread, quinoa) over refined grains.
- Typical serving examples: 1 slice whole-grain bread; 1/2 cup cooked rice or pasta; 1 cup ready-to-eat cereal (check label).
- Plate guidance: Grains typically occupy about one quarter of a MyPlate meal if included (focus on whole grains most of the time).
consistent carbohydrate diet guide is helpful when you want a carb-focused structure for the grains category.
- Vegetables
- Role: Micronutrients (vitamins A, C, K), fiber, and phytonutrients; emphasize variety and color.
- Choose: Dark leafy greens, cruciferous vegetables, orange and red vegetables, and legumes as vegetable sources.
- Typical serving examples: 1 cup raw leafy greens; 1/2 cup cooked vegetables; 3/4 cup vegetable juice.
- Plate guidance: Vegetables should fill about one quarter to half of a MyPlate meal (aim for half plate vegetables + fruit combined).
- Fruits
- Role: Vitamins, minerals, fiber and natural sugars. Whole fruits preferred over juices for fiber.
- Choose: Fresh, frozen, or canned (in water or natural juice) whole fruits; limit added sugars.
- Typical serving examples: 1 medium apple or banana; 1/2 cup chopped fruit; 1/4 cup dried fruit.
- Plate guidance: Together with vegetables, fruits should make up about half the plate in the healthy plate model.
- Protein foods
- Role: Building/repair (muscle, enzymes), essential amino acids, iron, B12 (animal sources), and plant-protein benefits.
- Choose: Lean meats, poultry, fish, eggs, beans, lentils, soy, nuts and seeds.
- Typical serving examples: 1 ounce cooked meat or 1/4 cup cooked beans; 1 egg; 1 tablespoon peanut butter.
- Plate guidance: Protein usually occupies about one quarter of the plate; plant proteins and seafood are encouraged by modern recommendations.
healthy food vitamin chart and vitamin requirements can help match protein choices to micronutrient needs.
- Dairy (or dairy alternatives)
- Role: Calcium, vitamin D (fortified), protein. Dairy appears as a side or beverage in plate guidance.
- Choose: Low-fat or fat-free milk, yogurt, fortified plant-based alternatives to meet calcium and vitamin D needs.
- Typical serving examples: 1 cup milk or yogurt; 1.5–2 ounces natural cheese.
- Plate guidance: Dairy is shown as a small portion on the side of the plate or as a cup; alternatives should be fortified to match nutrients.
Additional groups and considerations:
- Fats & oils: Small amounts of healthy fats (olive oil, avocado) are part of a balanced pattern; replace saturated fats with unsaturated types.
- Added sugars and ultra-processed foods: Minimize these; pyramid-era guidance gave less emphasis to added sugar limits, while modern guidelines explicitly recommend limiting added sugars (2025 USDA Dietary Guidelines, government report).
Transition: Now that you know the groups and portion examples, let’s translate this into step-by-step meal planning you can use at home.
How to Use the Food Pyramid Food Guide for Balanced Meal Planning
Using the food pyramid and the healthy plate together bridges daily targets (pyramid) with meal-level action (plate). Below are sequential how-to steps, followed by practical numbered tips you can apply at each meal.
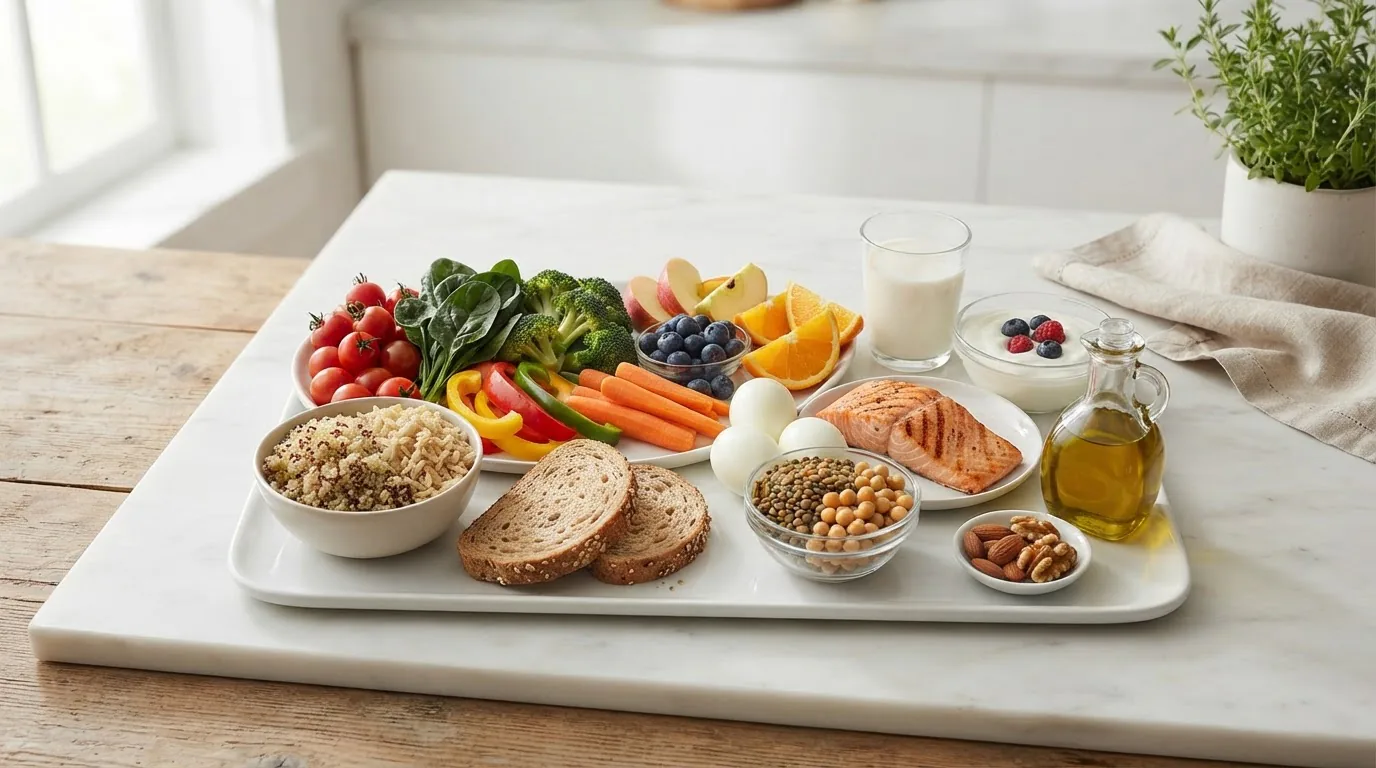
- Start with the plate: For each planned meal, visualize a plate divided into portions — half vegetables/fruit, one quarter grains (preferably whole), one quarter protein, and a side of dairy or alternative.
- Convert daily servings into meals: Use the pyramid to plan how many grain servings, vegetable servings and protein servings you need over the day, then distribute them across meals and snacks.
- Prioritize variety: Rotate types of vegetables, fruits, and proteins across the week to cover different micronutrients (see our varied diet guide and requirements).
- Measure and learn visuals: Use measuring cups and a kitchen scale until you can estimate portion sizes by sight — for example, a deck-of-cards-sized portion of cooked lean meat ≈ 3 ounces.
- Balance the day: If one meal is grain-heavy, shift vegetables or protein to the next meal to maintain daily totals suggested by the pyramid.
Practical numbered tips for each meal:
- Breakfast: Aim for one grain serving (e.g., 1 slice whole-grain toast or 1/2 cup oatmeal), 1 fruit serving, and a protein source (yogurt, eggs, or nut butter).
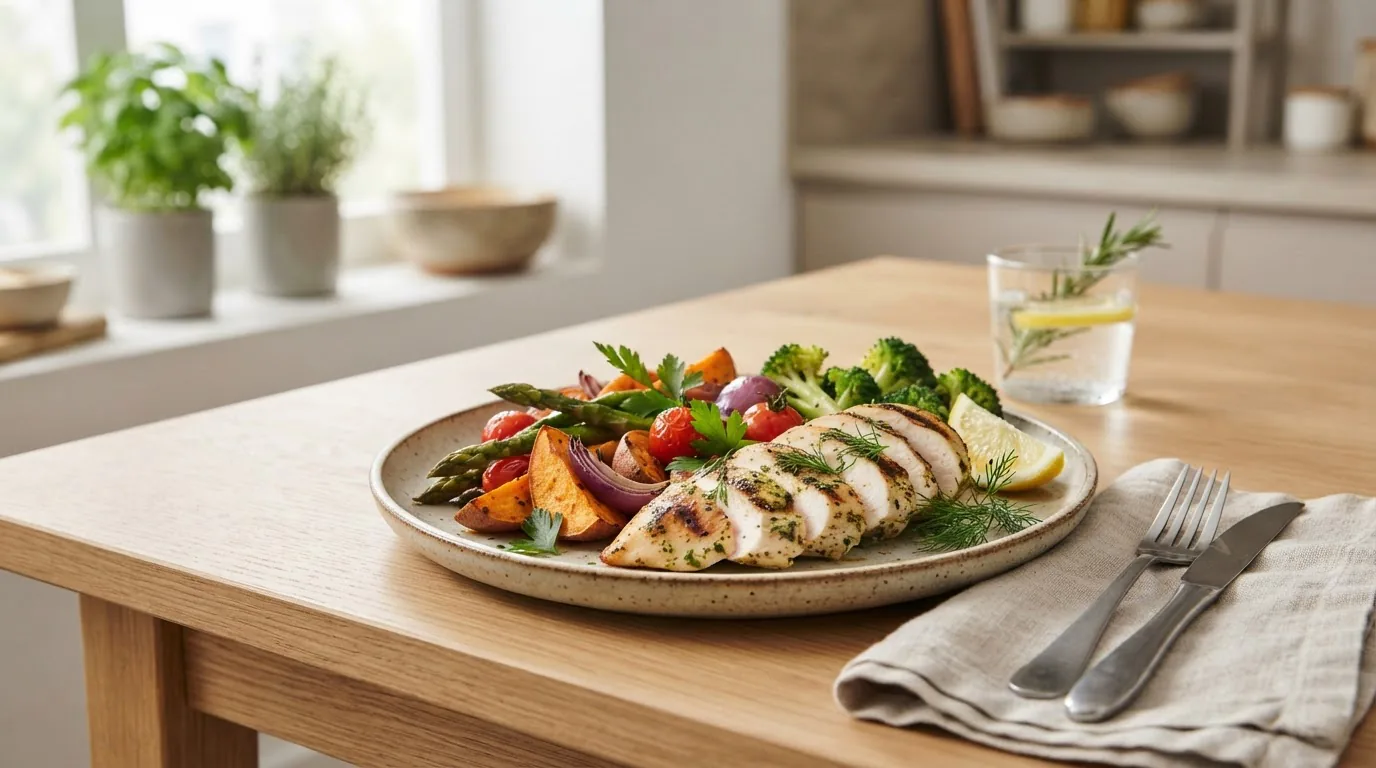
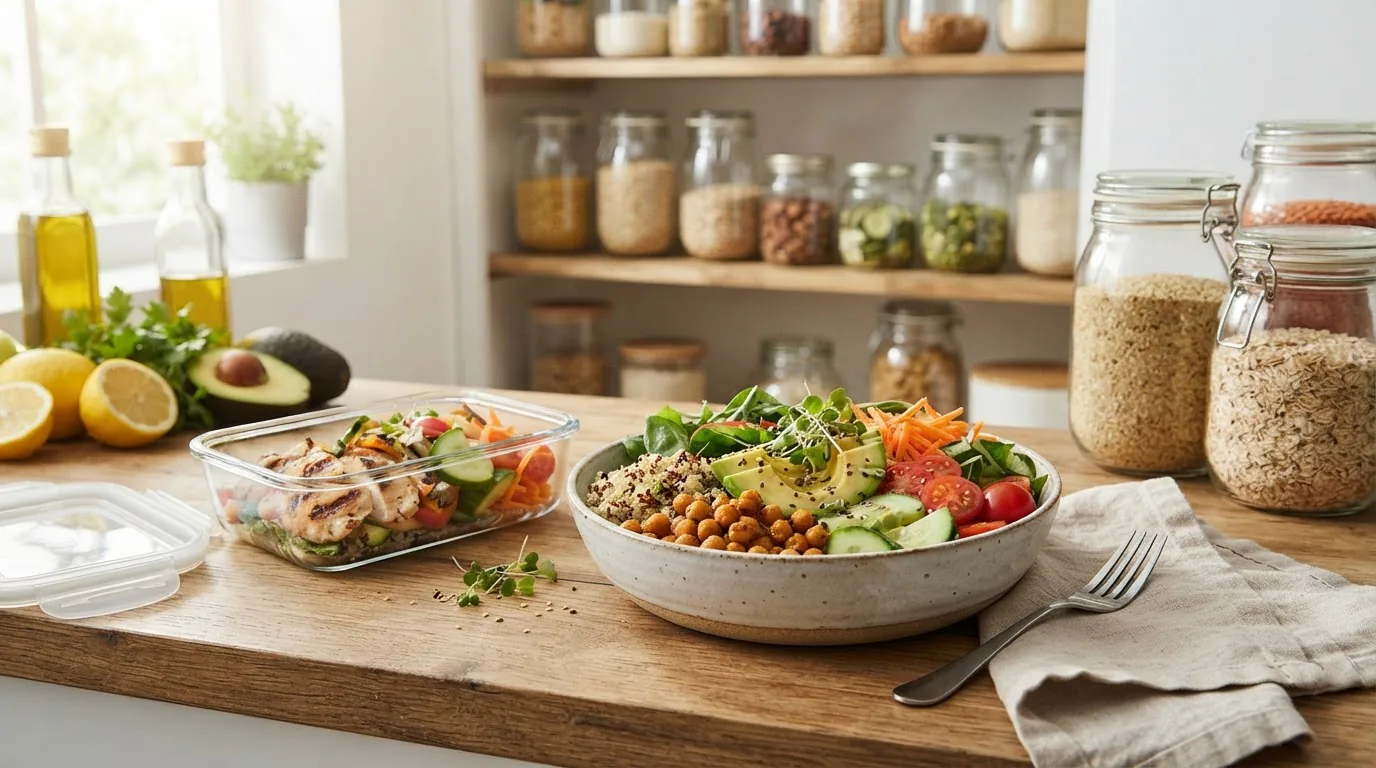
- Lunch: Build a plate with half non-starchy vegetables, one quarter whole grains (or starchy vegetable), and one quarter protein (beans, chicken, fish).
- Dinner: Mirror lunch priorities; include a small dairy portion if desired (milk, yogurt) or fortified plant-based alternative.
- Snacks: Use them to fill nutrient gaps (fruit + a handful of nuts, vegetable sticks + hummus) without exceeding daily calorie needs.
Family example (real-life application): The Lopez family (two working parents, two school-age children) uses the pyramid for weekly shopping and MyPlate for nightly meals. Each Sunday they map out five dinners where half the plate is vegetables (salad/roasted veggies), a grain side is mostly whole (brown rice or whole wheat pasta), and lean protein is portioned to 3–4 ounces per adult plate. This practical routine came from applying the plate model to dinner and the pyramid to the week’s total servings, saving time and improving fruit and vegetable intake in the household (family practice example).
Tools and printable resources:
- healthy diet worksheet and printable meal requirements helps families track portions and servings.
- meal planner printable guide and weekly menu requirements converts pyramid servings into practical menus.
- energy food requirements and diet plan guide if you have higher activity needs.
Transition: To apply these steps effectively you need clear serving-size targets — the next section provides those daily and per-meal serving guidelines with example menus.
Serving Sizes and Daily Servings for Each Food Group
Below is a clear stat block summarizing recommended daily ranges commonly used in U.S. guidance. Individual needs vary by age, sex, and activity; all numbers are illustrative ranges based on USDA-style recommendations (government guidance). Definitions: Adequate Intake (AI) is a Dietary Reference Intake used when an RDA cannot be determined; macronutrient refers to carbohydrates, proteins and fats — the main energy-providing nutrients (nutrition definitions).
Stat block — Typical adult daily ranges (approximate, general adult guidance):
- Vegetables: 2–3 cups per day (varied colors and types) — (government dietary guidance)
- Fruits: 1.5–2 cups per day — (government dietary guidance)
- Grains: 5–8 ounce-equivalents per day (with at least half whole grains) — (government dietary guidance)
- Protein foods: 5–6.5 ounce-equivalents per day (varies by calorie need) — (government dietary guidance)
- Dairy: 3 cups per day (or fortified alternatives) — (government dietary guidance)
- Oils: 5–7 teaspoons per day depending on caloric needs — (government dietary guidance)
Serving-size examples for common portions:
- 1 cup raw leafy greens = 1 vegetable cup-equivalent.
- 1/2 cup cooked vegetables or fruit = 1 cup-equivalent (fruit or vegetable serving often counted as 1/2 cup cooked).
- 1 slice bread or 1 ounce-equivalent grain = 1 grain serving.
- 1 ounce cooked meat, poultry, or fish = 1 ounce-equivalent of protein; 3 ounces ≈ deck-of-cards portion.
- 1 cup milk or yogurt = 1 dairy cup-equivalent; 1.5–2 ounces natural cheese ≈ 1 cup-equivalent.
Example daily menu servings (balanced adult, ~2000 kcal context as an example — adjust to individual needs):
- Breakfast: 1 cup oatmeal (2 grain servings), 1 medium banana (1 fruit), 1 cup low-fat milk (1 dairy), 1 tablespoon nuts (healthy fat).
- Lunch: Salad (2 cups mixed vegetables = 2 veg servings), 3 ounces grilled chicken (3 oz protein), 1 cup brown rice (2 grain servings).
- Snack: 1 cup yogurt (1 dairy), 1/2 cup berries (1 fruit).
- Dinner: 1 cup steamed broccoli + 1 cup mixed salad (3 veg servings), 1 medium baked potato (1 grain/starchy veg), 3 ounces salmon (protein), 1 small whole-grain roll (1 grain).
For readers interested in calorie-specific serving plans that align these serving sizes with energy targets, consult our detailed calorie meal plan and nutrition requirements and the macro meal planner and macronutrient requirements.
Walkthrough: Interpreting serving-size charts during meal prep
- Step 1: Keep a small kitchen scale and measuring cups handy for the first 1–2 weeks.
- Step 2: Plate meals using the healthy plate proportions; then measure components to learn visual equivalents.
- Step 3: Use the “deck of cards” (3 oz protein), “baseball” (1 cup), and “thumb” (1 tablespoon) visual cues to estimate once you’re comfortable.
Transition: Visual tools accelerate this learning — next we highlight the diagrams, pictures and printable charts that help you put these numbers into practice.
Visual Tools: Food Pyramid Diagrams and Healthy Plate Pictures to Guide You
Images and diagrams turn abstract serving numbers into meal-time decisions. Below we describe the most useful visual tools and recommend where to find high-quality printable images. For downloadable and printable options, check our visual resource collection: balanced diet images and printable nutrition charts.
Suggested visuals and how to interpret them:
- Food pyramid charts — Use these for weekly planning: each tier translates into target daily servings. Tip: overlay your family’s typical daily meals on the pyramid to spot gaps.
- Healthy plate images — Use at mealtime; glue a plate printout to the fridge for quick reference. Tip: color-code plate halves (green for vegetables, red for fruits) to simplify decisions.
- Portion photos — Series of photos showing 1 ounce, 3 ounces, 1 cup, etc. Place them in a kitchen binder. Tip: position these near your cutting board to estimate servings while cooking.
Sample image captions you can create for your fridge:
- “Half-Plate Veg + Fruit” — photo of a dinner plate split into 50% mixed vegetables and fruits.
- “Quarter-Plate Protein & Grains” — plate photo showing lean protein portion and a small whole-grain side.
- “Snack Pairing” — photo of fruit + small portion of nuts demonstrating a balanced snack (fruit = one cup, nuts = one ounce).
Tip: Use our downloadable charts to make an “adequate intake” quick card — measure common household portions, write conversions (1 cup = 240 mL; 1 ounce ≈ 28 g), and pin the card to your pantry. For more printable worksheets and plate guides, use healthy diet worksheet and printable meal requirements and our balanced diet images and printable nutrition charts.
Transition: Visual clarity helps answer common practical questions — the next section addresses the FAQs most readers have about the pyramid and plate requirements.
Common Questions About the Food Pyramid Food and Healthy Plate Requirements
Below are concise answers to frequently asked practical questions about combining pyramid and plate guidance into everyday meals.
What food groups should be in every meal? Aim to include at least two groups (fruit/vegetable + protein or grain + protein). Many meals benefit from three groups (vegetable + grain + protein) and a small dairy component when desired.
How many food groups per meal? Two to four groups is typical: breakfasts often include grain + dairy + fruit; lunches and dinners commonly include vegetables + protein + grains and optional dairy.
How to interpret the food triangle or pyramid diagram? Use the base tiers to guide frequency across the day (more grains and vegetables), and the top tiers (fats, sweets) to limit intake — combine with plate portions to convert servings into meals.
What framework diet should I follow? Use the healthy plate as your daily meal-building frame and the pyramid to check daily totals. Adjust portions based on age, activity, and health goals; consult a registered dietitian for personalized plans (Academy of Nutrition and Dietetics guidance).
Additional resources and comparisons:
- Old Food Pyramid Guide and Historical Dietary Requirements — historical context for educators.
- New Food Pyramid Guide and Updated Dietary Requirements — current recommendations and updates.
- portion and serving size guide and recommended requirements — quick conversions for home use.
Transition: To close, we summarize key takeaways and offer a clear call to action to start applying these tools immediately.
Conclusion: Applying Food Pyramid and Healthy Plate Principles for Long-Term Health
The most practical approach is to use both tools together: rely on the food pyramid (or updated daily serving guidance) to plan weekly and daily totals, and use the healthy plate to assemble each meal simply and visually. Focus on whole grains, a variety of vegetables, lean proteins, and appropriate dairy or fortified alternatives. Use visual aids, printable charts and portion guides to build confidence, and adapt recommendations to your age, activity level, and health goals. According to a 2025 USDA Dietary Guidelines advisory summary (government report), balanced dietary patterns that increase vegetables and whole grains while limiting added sugars and saturated fat are linked to improved long-term health outcomes (government guidance).
Start with one actionable change this week: make half your plate vegetables at dinner for five nights. Track the change with a printable worksheet and refine recipes to fit your family’s tastes. For printable meal planners and weekly menus that map pyramid servings to meals, see meal planner printable guide and weekly menu requirements. To learn more about calorie-specific plans aligned with these serving-size recommendations, review calorie meal plan and nutrition requirements.
Final CTA: Begin by printing a healthy plate graphic, measuring common household portions for one week, and comparing your intake to the pyramid targets. If you want tailored guidance, consult a registered dietitian or our recommended resources below.
References and authoritative resources:
- USDA MyPlate — official healthy plate guidance
- Nutrition.gov — federal nutrition resources (U.S.)
- Academy of Nutrition and Dietetics — evidence-based practice resources
Frequently Asked Questions
What is the food pyramid food guide?
The food pyramid food guide is a visual framework that ranks food groups by recommended daily servings, using a triangle to show relative proportions across a day to support balanced nutrition (government-style guidance).
How is the food pyramid different from the healthy plate model?
The pyramid shows daily servings and frequency across food groups, while the healthy plate (MyPlate) divides a single meal into portions (half vegetables/fruit, quarter grains, quarter protein) for immediate meal planning (USDA MyPlate guidance).
How much of my plate should be grains versus vegetables or protein?
Aim for roughly half the plate as vegetables and fruits combined, one quarter grains (preferably whole grains), and one quarter protein; dairy or fortified alternatives are a small side on the plate (USDA plate proportions).
How many servings of each food group should I eat daily according to the food pyramid?
Typical adult ranges: vegetables 2–3 cups, fruits 1.5–2 cups, grains 5–8 ounce-equivalents (half whole grains), protein 5–6.5 ounce-equivalents, dairy 3 cups — adjust by age, sex, and activity level (government guidance).
How do I create a balanced meal using the healthy plate model?
Fill half your plate with vegetables and/or fruits, allocate one quarter for whole grains or starchy vegetables, and one quarter for lean protein; add a small dairy portion or fortified alternative as desired (MyPlate meal-building rule).
How long does it usually take to see health benefits after following the food pyramid and healthy plate guidelines?
Some improvements like more stable energy and better digestion can appear within weeks; measurable changes in weight, blood lipids or blood pressure typically take 3–6 months and depend on overall calorie balance and activity (clinical evidence overview).
What should I do if I struggle to include all food groups in one meal?
Spread groups across the day: pair fruit or dairy in snacks, include vegetables with lunch and dinner, and use mixed dishes (stir-fries, grain bowls) to combine grains, veggies and proteins easily.
How reliable are USDA food pyramid charts for planning my meals?
USDA charts and MyPlate provide evidence-based, generalizable guidance for most people, but individual needs vary; consult a registered dietitian to tailor portions for medical conditions, pregnancy, or high athletic demands (government and professional guidance).