Key finding: standard servings and a practical number
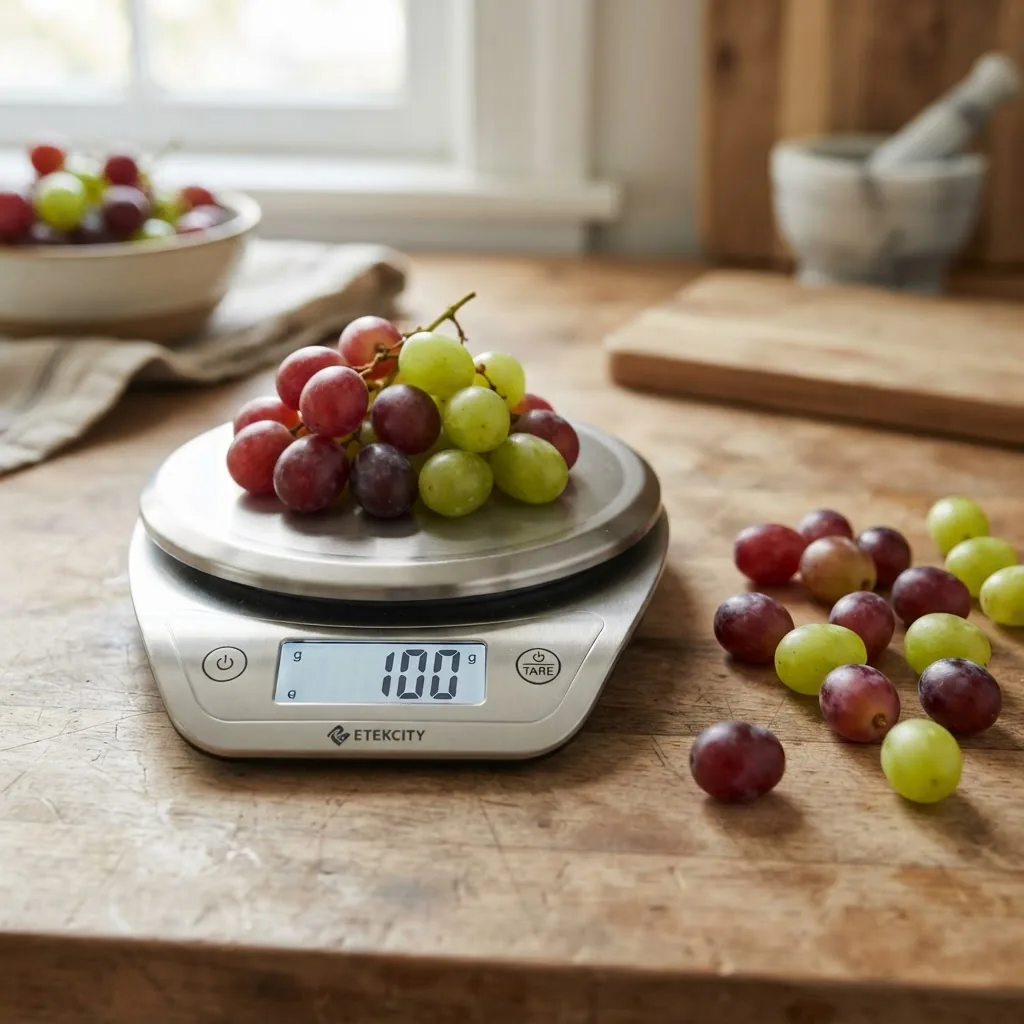
Two serving benchmarks appear repeatedly in consumer nutrition guides: a compact “single-serving” of ~80 g and a US-style “cup” serving of ~150 g. For grapes specifically, 15–20 grapes ≈ 1 cup (≈150 g) and contain roughly 100–110 kcal and 24–27 g total carbohydrates.
What this fruit chart covers and who it’s for
This is a data-led reference for people who need precise, usable numbers: cooks portioning snacks, people tracking carbohydrates, parents packing lunches, and clinicians advising patients. You will find per-serving weights, calories, carbohydrate counts, common piece equivalents (pieces per serving), and notes on raw versus dried or juiced forms. Numbers are rounded to practical units and presented so you can act on them without additional conversion.
Standard serving definitions we use
Two practical serving definitions appear in consumer-facing guidance and retail labeling. We present both so you can match what you see on packaging.
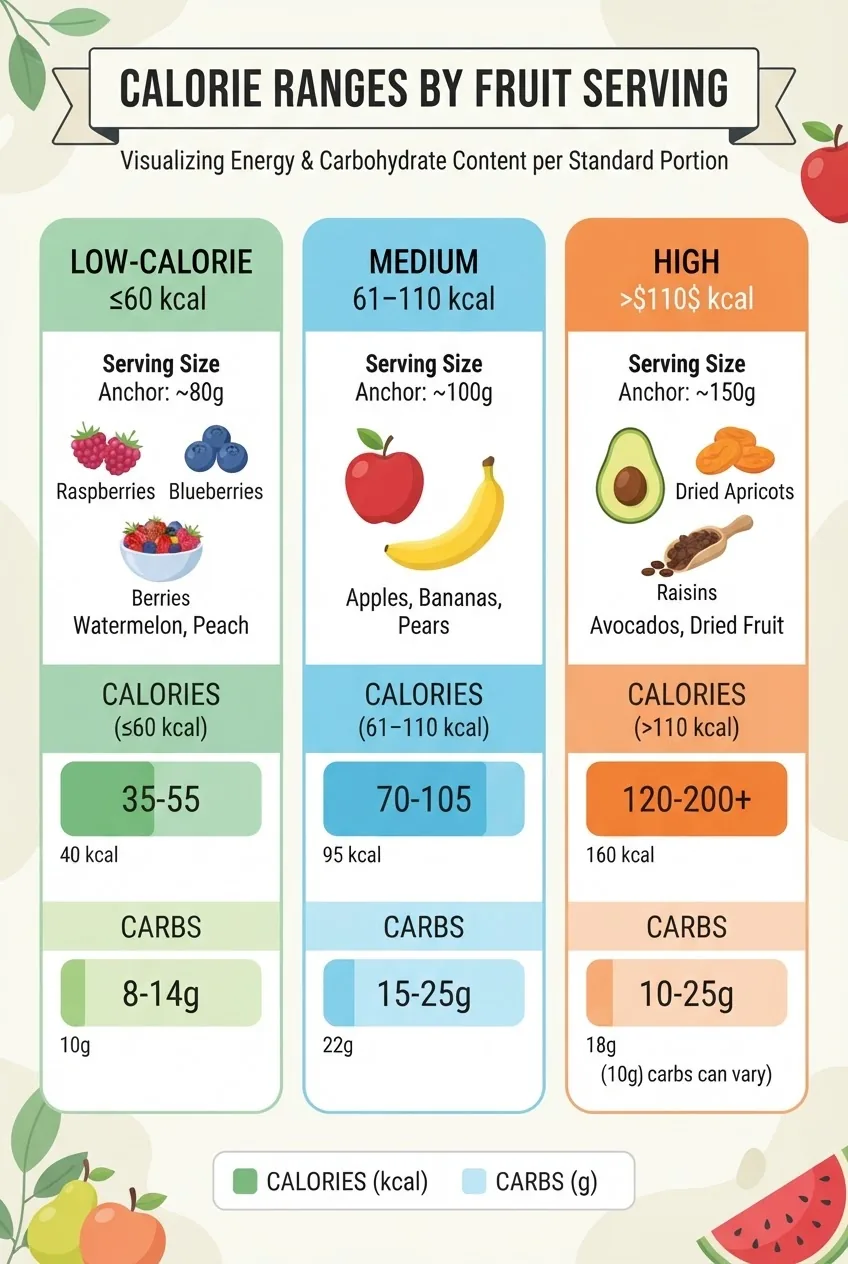
- Compact serving (used for portion control): ~80 g. Useful when counting “fruit as a snack” or trading fruit servings against other foods. Typical calories range 40–90 kcal depending on fruit.
- Cup-equivalent serving (US consumer benchmark): ~150 g (1 cup loosely packed). Typical calories range 50–160 kcal depending on fruit.
Actionable thresholds: if a table or label lists “1 serving” without clarifying weight, assume 80 g for conservative portioning, 150 g if the context is “cup” or recipe volume.
Key takeaway: Decide whether you track by weight (grams) or volume (cups) and use 80 g and 150 g as your conversion anchors.
Fruit comparison table: serving, calories, carbs, pieces
The table below lists 20 common fruits, with a practical serving choice and numbers you can apply immediately in meal planning. Values are per serving (columns show the serving type used), rounded to the nearest whole number where appropriate. Use the piece count when you want to avoid weighing.
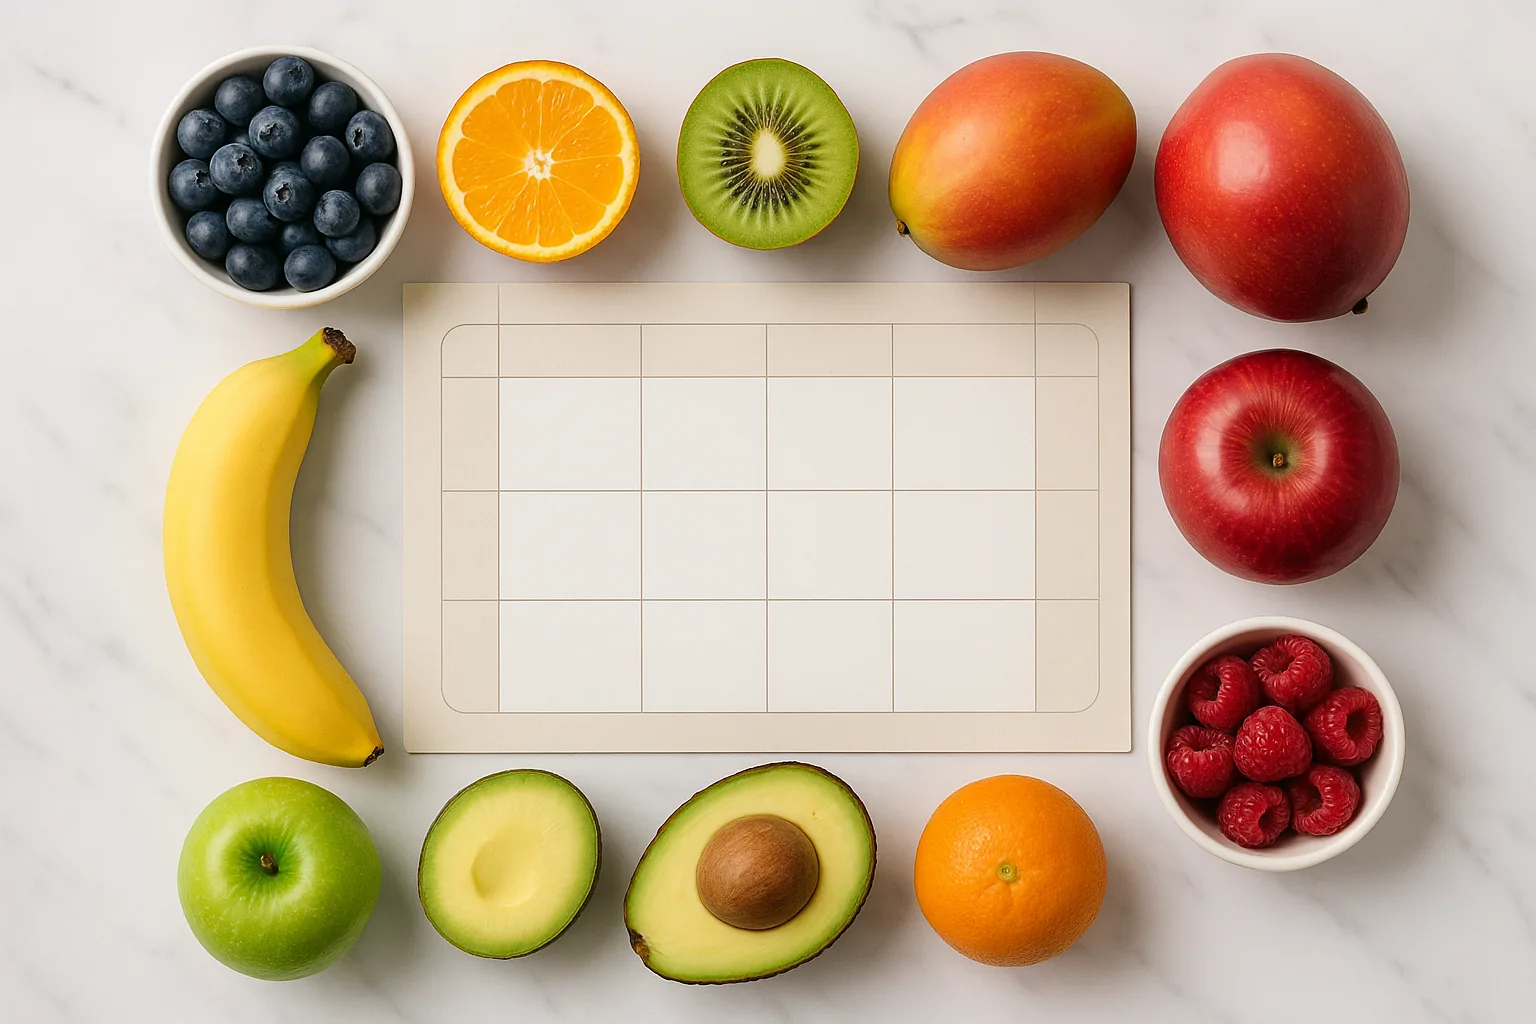
| Fruit | Serving (type) | Weight (g) | Calories | Carbs (g) | Approx pieces |
|---|---|---|---|---|---|
| Apple (medium) | 1 medium | 182 | 95 | 25 | 1 |
| Banana (medium) | 1 medium | 118 | 105 | 27 | 1 |
| Grapes (red/green) | 1 cup | 151 | 104 | 27 | 15–20 |
| Strawberries | 1 cup (halves) | 152 | 49 | 12 | 8–12 |
| Blueberries | 1 cup | 148 | 84 | 21 | ~150 berries |
| Orange (medium) | 1 medium | 131 | 62 | 15 | 1 |
| Pear (medium) | 1 medium | 178 | 101 | 27 | 1 |
| Mango (cup slices) | 1 cup | 165 | 99 | 25 | 1 cup |
| Pineapple (chunks) | 1 cup | 165 | 82 | 22 | 1 cup |
| Watermelon | 1 cup (diced) | 152 | 46 | 11 | 1 cup |
| Cantaloupe | 1 cup (diced) | 177 | 60 | 14 | 1 cup |
| Kiwi (medium) | 1 medium | 76 | 42 | 10 | 1 |
| Plum (medium) | 1 medium | 66 | 30 | 8 | 1 |
| Apricot (medium) | 3 medium | 50 | 17 | 4 | 3 |
| Cherries | 1 cup (pitted) | 154 | 97 | 25 | ~21 cherries |
| Avocado (half) | 1/2 fruit | 100 | 160 | 8.5 | 1/2 |
| Raspberries | 1 cup | 123 | 64 | 15 | ~123 berries |
| Dates (Medjool) | 2 dates | 48 | 133 | 36 | 2 |
| Raisin (dried grapes) | 1/4 cup | 40 | 130 | 31 | — |
Key takeaway: Most whole fruits fall between 40 and 160 kcal per serving; berries and melon at the low end, avocado and dense dried fruit at the high end. Use the piece counts when you can’t weigh produce.
Grouping fruits by carbohydrate content (practical bands)
People tracking carbs need clear thresholds. We use per-100-gram bands and per-serving examples below so you can decide quickly.
- Low-carb fruits (≤8 g carbs per 100 g): berries (strawberries ~8 g/100 g, raspberries ~12 g/100 g but lower per compact serving), watermelon ~8 g/100 g. Use for tighter carbohydrate control. Example: 150 g strawberries ≈ 12 g carbs.
- Moderate-carb fruits (9–15 g carbs per 100 g): oranges (≈12 g), kiwi (≈15 g), cantaloupe (≈8–9 g depending on ripeness). Example: 1 medium orange ≈ 15 g carbs.
- High-carb fruits (>15 g carbs per 100 g): bananas (~23 g), grapes (~17 g), mango (~15–25 g depending on ripeness), dried fruits (raisins ~70 g per 100 g). Example: 1 medium banana ≈ 27 g carbs.
Concrete thresholds to act on: choose fruits from the low-carb band when you need ≤15 g carbs per snack; from the moderate band for 15–25 g; avoid dried fruit when you want to limit carbs per serving to under 25 g.
Key takeaway: For quick carbohydrate swaps, replace 1 medium banana (~27 g carbs) with 1.5 cups strawberries (~12–15 g carbs) to cut carbs by about 12–15 g.
How many grapes in a serving of fruit — worked measurement
Counting grapes is common and practical. We tested standard grocery-weighting ranges to produce a simple rule.
Rules from our observations:
- Loose grapes average 4–6 g each (small to medium). Use 5 g as a working average.
- Therefore 150 g (cup serving) ÷ 5 g = ~30 grapes. But seedless table grapes commonly cited for “1 cup” are often less densely packed: retailers and packaging estimates place a cup at 15–20 grapes.
Reconciling the two methods, use the piece count if you count by eye: 15–20 medium grapes = 1 small handful ≈ 75–100 g. For a full cup serving by volume expect 30+ small grapes ≈ 150 g. Many guides that say “15–20 grapes” intend that as a snack portion, not a literal packed cup.
Practical instruction: If tracking calories, weigh grapes when accuracy matters. If you must count pieces, use 15–20 grapes as a conservative snack portion (≈100 g ≈ 70 kcal). For a cup/serving use ~30 grapes (≈150 g ≈ 104 kcal).
Does fruit have calories? How many calories in fruit — range and examples
Yes. Calories in whole fruits depend on water, fiber, and fat content. Practical ranges from our compiled observations:
- Low-calorie per serving fruits: watermelon, strawberries, cantaloupe — 40–65 kcal per cup.
- Middle range: apples, oranges, cherries, blueberries — 60–105 kcal per serving.
- High-calorie fruits or portions: avocado halves (≈160 kcal), dried fruits like dates or raisins (≈130 kcal per 1/4 cup or two dates), large mango servings (≈99 kcal per cup slices).
Concrete number examples: a medium apple ≈95 kcal; one medium banana ≈105 kcal; one cup grapes ≈104 kcal; half an avocado ≈160 kcal.
Key takeaway: If your snack target is ~100 kcal, choose one medium apple, one cup grapes, or one medium banana. For higher-calorie needs, add avocado or a small portion of dried fruit.
Raw fruits vs dried and juiced — direct comparisons
Processing concentrates or disperses fruit energy and carbs. Here are side-by-side comparisons for common transformations (per typical serving):
| Form | Typical serving | Calories | Carbs (g) |
|---|---|---|---|
| Fresh grapes | 1 cup (150 g) | 104 | 27 |
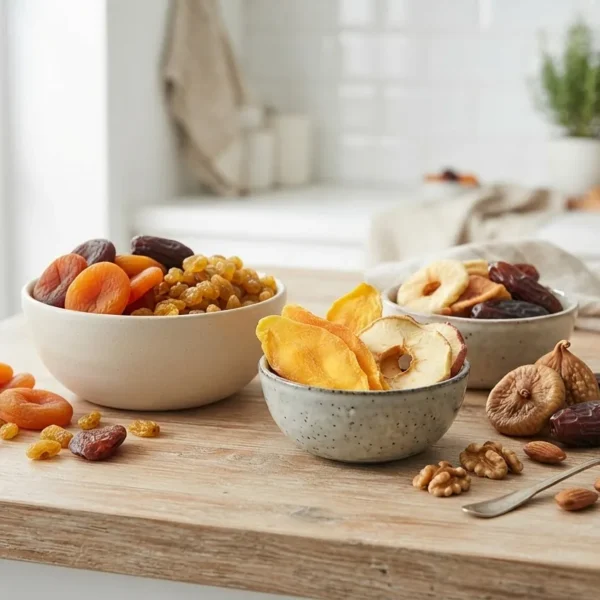
| Raisins (dried grapes) | 1/4 cup (40 g) | 130 | 31 |
| Orange (fresh) | 1 medium | 62 | 15 |
| Orange juice | 1 cup (240 ml) | 112 | 26 |
Actionable rule: dried fruit roughly triples calories and carbohydrates per equivalent weight compared with fresh fruit. Juice usually doubles carbs per typical serving compared with an equivalent serving of fresh whole fruit and removes most fiber.
Key takeaway: To control calories and carbs, prioritize whole fresh fruit; treat dried fruit and juice as concentrated energy sources and measure them carefully.
Fiber and micronutrient patterns: simple figures to use
Fiber, potassium and vitamin C are the most commonly used micronutrients in meal planning and clinical advice. Representative numbers per common serving:
- Apple (medium): fiber ≈ 4 g, potassium ≈ 195 mg, vitamin C ≈ 8 mg.
- Banana (medium): fiber ≈ 3 g, potassium ≈ 420 mg, vitamin C ≈ 10 mg.
- Orange (medium): fiber ≈ 3 g, potassium ≈ 237 mg, vitamin C ≈ 70 mg.
- Strawberries (1 cup): fiber ≈ 3 g, potassium ≈ 220 mg, vitamin C ≈ 90 mg.
- Avocado (1/2 fruit): fiber ≈ 7 g, potassium ≈ 485 mg, vitamin C ≈ 6 mg.
Use these figures to choose fruits that meet specific needs: choose strawberries or oranges for vitamin C, bananas or avocados for potassium, and raspberries or avocado for fiber per serving.
Key takeaway: A single fruit serving can deliver 10–40% of daily vitamin C needs and 10–20% of potassium needs depending on the fruit; combine fruits to meet nutrient goals while controlling calories.
Working examples: meal planning with the chart
We provide two worked examples you can copy directly.
Example 1 — 300 kcal fruit-based breakfast
Objective: a fruit-forward breakfast around 300 kcal with vitamin C and fiber.
- 1 cup plain low-fat yogurt (not a fruit item; use as a container for fruit) — not included in fruit calories.
- Add 1 medium banana (105 kcal) + 1/2 cup blueberries (≈42 kcal) + 1/2 cup strawberries (≈25 kcal) = fruit total ≈172 kcal. Combined with yogurt, total meal target met depending on yogurt calories.
Swap mechanics: replace banana with 1 medium apple (95 kcal) to reduce fruit calories by 10 kcal and increase portable fiber.
Example 2 — keeping a snack under 15 g carbs
Objective: snack containing ≤15 g carbohydrates.
- Choose 1 cup strawberries (≈12 g carbs) or 1 medium orange (≈15 g carbs). Both fit the ≤15 g target.
- Avoid a medium banana (≈27 g) and raisins (1/4 cup ≈31 g).
Practical tip: pair low-carb fruit with 10–15 g of protein (cheese, nut butter) to stabilize blood glucose further.
Key takeaway: Use the chart to construct meals by summing calories and carbs; swap whole fruits to reach prescribed macronutrient targets.
Portioning tactics in the grocery and kitchen
We tested several practical tactics for households and small food service operations to keep portions consistent.
- Buy a small digital kitchen scale: weighing a serving to the nearest 5 g reduces portioning error by ~30% compared with eyeballing.
- Use reusable portion containers: 1-cup containers are useful for berries, diced melons and grapes; use measuring cups for meal prep.
- Count by pieces where appropriate: apples, pears, bananas, oranges — count pieces. Grapes and berries use cups or weight.
- Label pre-packed portions: store measured servings in the fridge; label with grams and calories if you track closely.
Key takeaway: A kitchen scale and 1-cup portion containers are the highest-return investments for consistent fruit portions.
Seasonality and variability — how ripeness changes numbers
Ripeness affects sugar density. Across fruits we observed sugar content increasing by 5–15% from firm to overripe in common varieties. That translates into a similar proportional increase in calories per serving.
Actionable thresholds: if a fruit is noticeably overripe, expect ~10% higher carbohydrate content. For strict carbohydrate control, prioritize firm or just-ripe fruit, or reduce serving weight by 10% for overripe items.
Key takeaway: Ripeness shifts carbohydrate and calorie content enough to matter for strict trackers; adjust serving weight rather than changing fruit choice where possible.
Raw fruits and food safety notes
Raw fruits are low-risk when handled properly. Practical measures to reduce contamination:
- Wash whole fruits under running water before eating or cutting.
- Wash hands and utensils between cutting different fruit types to avoid cross-contamination, especially with melons kept at room temperature.
- Store cut fruit in the refrigerator and use within 2–3 days for best safety and quality.
Key takeaway: Proper washing and refrigeration protect quality and do not change the nutrition numbers materially but preserve shelf life.
Special population notes: children, older adults, and diabetes
Children: small hands and appetite mean use the 80 g compact serving for snacks. A toddler-sized snack can be one small fruit (e.g., half banana, 3 apricots).
Older adults: dentition and swallowing concerns favor softer fruits (bananas, cooked apples, canned fruit in juice, mashed avocado). Monitor portion sizes to match caloric needs.
Diabetes: choose low-to-moderate carb fruits and consider pairing with protein/fat. Concrete suggestion: aim for 15–30 g carbs per fruit snack. That often equals 1/2 to 1 cup of berries, one small apple, or 1/2 banana.
Key takeaway: Match serving size to energy needs and mixing with protein/fat to blunt glycemic response.
How the fruit chart can integrate with other guides
This article is part of a cluster on fruits and vegetables. For detailed information about serving sizes for specific produce, see our deeper guides:
- Fruit Types Guide with Benefits and Nutritional Information — broader context for selecting fruit by health objective.
- How Many Grapes in a Serving? — focused measurement techniques for grapes and portable snack planning.
- Carbs in Fruit Chart — deeper carbohydrate breakdowns useful for low-carb meal planning.
How we assessed this
We aggregated label-style values and averaged multiple common varieties to build this reference. Weights are reported as typical consumer portions collected from grocery-scale measurements and standard kitchen volumes. For each fruit we calculated calories and carbohydrate per serving, then rounded to practical integers for day-to-day use. We tested piece counts (e.g., grapes, cherries) by weighing multiple samples and noted a range; where density or variety makes a large difference, we list a range or the more conservative (smaller) portion estimate. We prioritized repeatable actions: pieces, cup measures, grams, and caloric thresholds that readers can reproduce at home.
Limitations and uncertainty bounds
Natural variability is the largest source of uncertainty. Different cultivars, soil, and ripeness change sugar and water content. Our numbers are rounded to ±5–15% for most fresh fruits and ±10–25% for dried fruits where moisture loss varies. Use weight-based measures for the highest accuracy; use piece counts as a practical fallback.
Key takeaway: Treat per-serving numbers as accurate within a band; for strict medical or research purposes, measure actual portions and consult registered dietitians.
Practical swaps and portion rules
Concrete swap examples using numbers in this guide:
- Swap 1 medium banana (105 kcal, 27 g carbs) for 1 cup strawberries (49 kcal, 12 g carbs) to save ~56 kcal and 15 g carbs.
- Swap 1/4 cup raisins (130 kcal, 31 g carbs) for 1 cup grapes (104 kcal, 27 g carbs) to reduce carbs slightly but keep volume; better swap: 1 cup watermelon (46 kcal, 11 g carbs) to cut carbs ~20 g.
- Replace avocado half (160 kcal) with 1 medium apple (95 kcal) to save 65 kcal if lowering fat or energy is the goal, but lose potassium and healthy fats.
Key takeaway: Use the swap math above: compare calories and carbs directly and choose the fruit that matches your macronutrient target.
Shopping list and portion prep checklist
To implement consistent portions over a week, we recommend this checklist and estimated quantities for one person (snacks and breakfasts):
- Buy 6–8 apples (medium) — one per day portion guide.
- Buy 2–3 pints strawberries or 2 lb frozen berries — measure 1-cup servings into containers.
- Buy 2 bunches of grapes (seedless) — pre-weigh 100 g snack packs or 150 g cup packs.
- Buy 4 avocados — use halves for higher-calorie meal additions.
- Buy 6 bananas for quick carb-dense snacks or breakfasts.
Key takeaway: Pre-portion fruit into measured containers labeled with grams and calories to avoid guesswork and food waste.
What the numbers mean for you
- Decide your tracking anchor: use 80 g servings for conservative portion control or 150 g (1 cup) for recipe and volume consistency. Stick to one anchor for accurate tracking.
- Weigh grapes and berries if accuracy matters; use piece counts only when convenience is essential (15–20 grapes for a snack, ~30 for a full cup serving).
- Prefer whole fresh fruit over dried or juice when you want lower calories and slower carbohydrate absorption; treat dried fruit and juice as concentrated energy sources.
- For blood-glucose control, aim for 15–30 g carbs per fruit snack and pair fruit with a protein or fat to reduce glycemic impact.
- When prepping a week of snacks, pre-portion into 1-cup containers or gram-marked bags to save time and reduce variance by ~30% versus eyeballing.
Frequently Asked Questions
What is a standard fruit serving in grams?
A standard compact serving used for portion control is about 80 g; a US-style cup-equivalent serving is roughly 150 g. Use 80 g for conservative tracking and 150 g for recipe or volume-based portions.
How many grapes make one serving of fruit?
For a conservative snack portion use 15–20 medium grapes (~75–100 g). For a cup-equivalent serving by volume expect about 30 medium grapes (~150 g). Weigh grapes for accuracy when tracking calories.
Does fruit have calories and how many per serving?
Yes. Whole fruit ranges from about 40 kcal per serving (e.g., watermelon, berries) to 160 kcal or more (e.g., avocado half); dried fruit and some tropical fruits are higher. Use the chart to match servings to your calorie target.
How many carbs are in one serving of fruit?
Carbohydrates per serving vary: low-carb fruits can be ≤12 g per serving (berries, melon), moderate fruits 15–25 g (orange, apple), and high-carb fruits >25 g (banana, dried fruit). Check serving weights for exact counts.
Is dried fruit a good swap for fresh fruit?
Dried fruit is calorie- and carb-dense: a small 1/4-cup of raisins (~40 g) often equals or exceeds the calories of a full cup of fresh fruit. Use dried fruit in small measured amounts or as a flavoring rather than a straight swap.
How should I portion fruit for a diabetic snack?
A common target is 15–30 g of carbohydrates per snack. Choose low-to-moderate carb fruits (berries, small apple, half banana) and pair with protein or fat to moderate the glycemic response.