
Answer: The carbs in fruit chart is a reference table listing total carbohydrates, dietary fiber, net carbs (total carbs minus fiber) and sugar per standard serving for common U.S. fruits, designed to help you compare fruits quickly and manage carbohydrate intake for weight, ketogenic, or diabetic-conscious diets using USDA-sourced values.

Understanding Carbohydrates in Fruits
Answer: Fruits contain carbohydrates made up of sugars, starches and dietary fiber; the balance of these components determines how a fruit affects blood sugar and net-carb totals important for carb-conscious diets.
Dietary fiber: non-digestible plant carbohydrate that reduces net carbs and slows glucose absorption.
Net carbs: total carbohydrates minus fiber — think of net carbs as the carbs that truly impact blood sugar and ketosis.
Glycemic index: a relative scale (0–100) that rates how quickly a carbohydrate-containing food raises blood sugar compared with pure glucose.
Fruits contain three main carbohydrate types: simple sugars (glucose, fructose, sucrose), starch (minor in most ripe fruits), and dietary fiber. Simple sugars are quickly available for energy; fiber is structurally bound and resists digestion in the small intestine, lowering the amount of carbohydrate that enters the bloodstream.
Carbohydrates in fruit behave differently than refined carbs because fiber and fruit matrices slow digestion. This means two fruits with the same total carbohydrate content can have different blood-sugar effects if one has more fiber or polyphenols that blunt glucose spikes. For clinical context, According to the USDA FoodData Central (2023 dataset), listed carbohydrate values are measured per specific serving sizes and vary with ripeness and variety; treat chart values as accurate averages for common U.S. fruit varieties.
How the body processes fruit carbs:
- Chewing and salivary enzymes begin breakdown of carbohydrates.
- Simple sugars are rapidly absorbed in the small intestine and increase blood glucose.
- Fiber reaches the colon, where some ferment to short-chain fatty acids that benefit metabolism and gut health.
Practical takeaway: prioritize fiber-rich fruits or smaller portions of higher-sugar fruits to manage post-meal glucose and total daily carbohydrate targets.
For broader fruit category context see Fruit Types Guide with Benefits and Nutritional Information.
Carbs in Fruit Chart: Comprehensive Nutritional Data
Answer: Below is a detailed, USDA-sourced table comparing total carbohydrates, dietary fiber, net carbs and sugars per standard serving for 20 commonly consumed U.S. fruits so you can sort and plan portions quickly.
Note: values rounded to the nearest tenth; net carbs = total carbs − fiber. According to the USDA FoodData Central (2023 dataset), actual values vary by cultivar and ripeness; use these as consistent planning averages. For in-depth avocado nutrition see Avocado Fruit Guide and Nutritional Benefits. For calorie context see Calories in Fruit Guide. For serving-size focus see Fruit Chart Guide with Nutrition Facts and Serving Sizes.
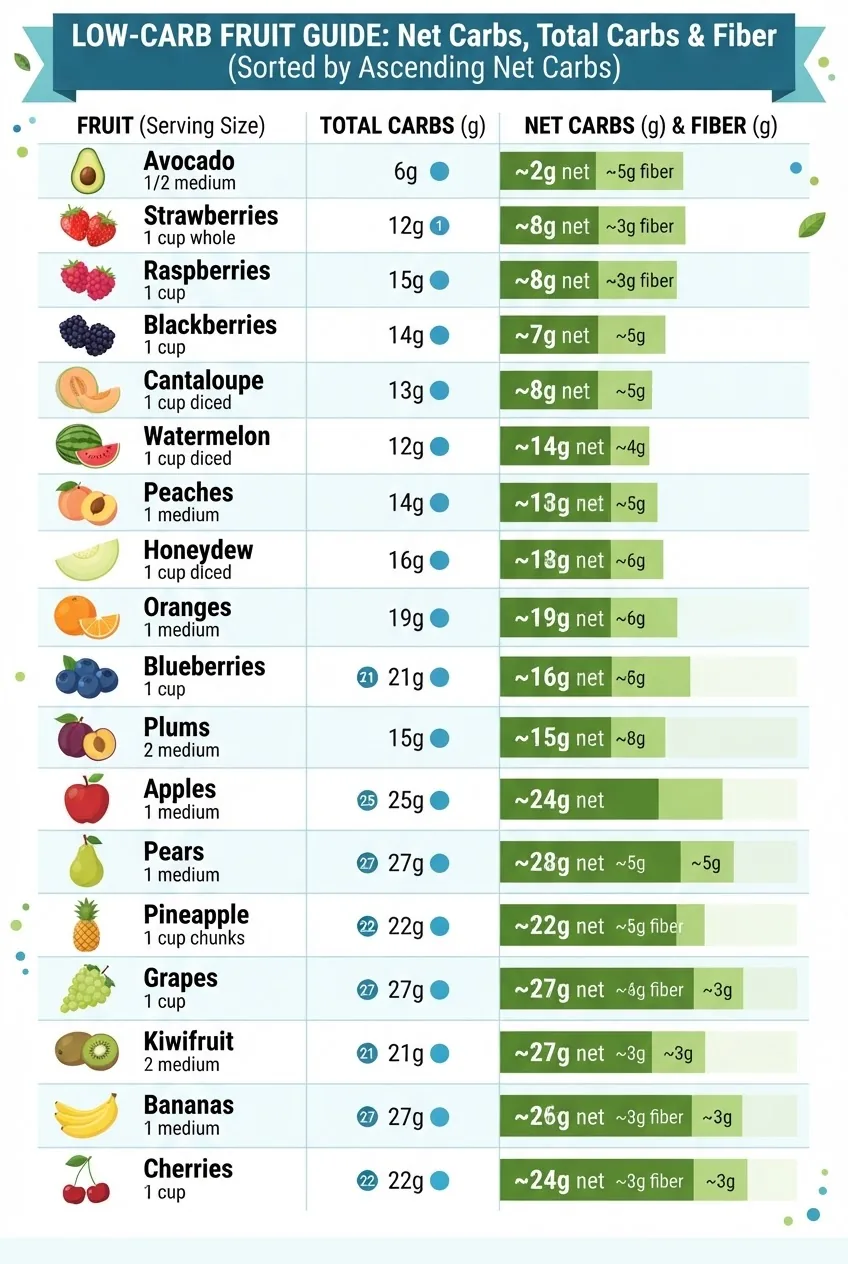
| Fruit | Serving size | Total carbs (g) | Dietary fiber (g) | Net carbs (g) | Sugar (g) |
|---|---|---|---|---|---|
| Avocado | 1 medium (150 g) | 12.8 | 10.0 | 2.8 | 0.2 |
| Raspberries | 1 cup (123 g) | 14.7 | 8.0 | 6.7 | 5.4 |
| Blackberries | 1 cup (144 g) | 13.8 | 7.6 | 6.2 | 7.0 |
| Strawberries | 1 cup (144 g) | 11.7 | 3.0 | 8.7 | 7.4 |
| Kiwi | 1 medium (76 g) | 10.1 | 2.1 | 8.0 | 6.2 |
| Peach | 1 medium (150 g) | 14.7 | 2.3 | 12.4 | 11.4 |
| Cantaloupe | 1 cup diced (160 g) | 13.0 | 1.4 | 11.6 | 12.8 |
| Watermelon | 1 cup diced (152 g) | 11.6 | 0.6 | 11.0 | 9.4 |
| Grapefruit | 1/2 medium (123 g) | 13.1 | 2.0 | 11.1 | 7.0 |
| Orange | 1 medium (131 g) | 15.4 | 3.1 | 12.3 | 12.2 |
| Apricot | 3 medium (50 g) | 8.4 | 1.7 | 6.7 | 6.2 |
| Plum | 1 medium (66 g) | 7.6 | 0.9 | 6.7 | 6.5 |
| Strawberries (sliced) | 1 cup (144 g) | 11.7 | 3.0 | 8.7 | 7.4 |
| Blueberries | 1 cup (148 g) | 21.4 | 3.6 | 17.8 | 14.7 |
| Cherries | 1 cup (154 g) | 25.4 | 3.3 | 22.1 | 20.8 |
| Grapes | 1 cup (151 g) | 27.3 | 1.4 | 25.9 | 23.4 |
| Mango | 1 cup sliced (165 g) | 25.0 | 2.6 | 22.4 | 23.0 |
| Pineapple | 1 cup chunks (165 g) | 21.7 | 2.3 | 19.4 | 16.3 |
| Pear | 1 medium (178 g) | 27.1 | 5.5 | 21.6 | 17.4 |
| Banana | 1 medium (118 g) | 27.0 | 3.1 | 23.9 | 14.4 |
Source notes: carbohydrate and fiber data are averaged from USDA FoodData Central entries (2023) and rounded for clarity. Values vary by ripeness, cultivar and measurement method; treat these numbers as planning references rather than absolute lab results.
How to Use the Carbs in Fruit Chart for Health and Diet
Answer: Use the chart to select fruits that fit your daily carbohydrate target by comparing net carbs per serving, choosing fiber-rich fruits, adjusting portion sizes and timing fruit intake around activity or medication to control blood sugar.
Quick rules for practical use:
- Set a daily net-carb target (for example, 20–50 g for many low-carb plans) and pick fruit servings that fit within it.
- Prefer fruits with lower net carbs per serving (avocado, berries, apricot) when aiming for strict carb limits.
- Pair higher-carb fruits with protein or healthy fat to slow glucose absorption.
- Weigh or measure fruit servings when accuracy matters: nutrition labels or a kitchen scale reduce portion errors.
Step-by-step: reading a fruit nutrition label
1) Find “Total Carbohydrate (g)” and “Dietary Fiber (g)”. 2) Subtract fiber from total carbs to get net carbs. 3) Check serving size to confirm it matches the portion you plan to eat. This walkthrough follows common label layout and practical label-reading experience.
Example case study: managing 30 g net carbs per day for a low-carb meal plan.
- Breakfast: 1/2 avocado (≈1.4 g net) + eggs.
- Snack: 1/2 cup raspberries (≈3.4 g net) mid-morning.
- Lunch: vegetables and lean protein.
- Dessert: 1 small apple (≈20.7 g net) only if remaining daily allowance permits.
Clinical guidance: for people with diabetes, follow ADA recommendations on carbohydrate counting and meal planning; see the American Diabetes Association for guidelines and personalized planning — American Diabetes Association. According to the ADA (2024 guidance summary), consistent carbohydrate intake and portion control are key to predictable blood-sugar management.
Avoid these common pitfalls:
- Using total carbs without subtracting fiber when counting net carbs for ketogenic or low-carb diets.
- Assuming dried fruit equals fresh fruit—drying concentrates sugar and carbs per serving.
- Not adjusting for ripeness—riper fruits often have more available sugars and higher glycemic responses.
For advice on how vegetables fit into carb planning and whether vegetables might be a better fit than some fruits, read Are Vegetables Bad for You?. For weight-loss-specific fruit choices see Best Fruits for Weight Loss Guide.
Comparing Carbohydrates of Fruits: Which Fruits Are Best for Different Diets?
Answer: Low-carb diets favor high-fiber, low-net-carb fruits (avocado, raspberries, blackberries); moderate-carb plans can include apples, oranges and peaches in controlled portions; diabetics should prioritize fiber, portion control and lower-glycemic fruits.
Low-carb vs high-carb fruits — quick comparisons:
- Best for very low-carb/keto: Avocado (≈2.8 g net), raspberries (≈6.7 g net), blackberries (≈6.2 g net).
- Moderate carb, nutrient-dense: Strawberries, kiwi, peach, grapefruit — offer vitamins with modest net carbs.
- High-carb choices to limit or portion: Grapes, banana, mango, pear — high natural sugars and high net carbs per serving.
Glycemic index considerations: a fruit with moderate net carbs can still produce a smaller glucose response if it has fiber and polyphenols; for example, berries typically have lower glycemic indices than tropical fruits with similar sugars. For clinical advice on glycemic response and diabetes, review guidance from the American Diabetes Association.
Comparing fruit carbs to vegetables:
- Most non-starchy vegetables (leafy greens, cucumbers, broccoli) have considerably fewer net carbs per serving than most fruits.
- Starchy vegetables (potato, corn) can rival or exceed fruit carbs per serving; for vegetable carb comparisons see 100 Vegetables Name Guide and Are Green Beans Fruit or Vegetable Guide.
Diet-specific takeaways:
- Keto: prioritize avocados and berries; measure portions and emphasize fats and proteins.
- Diabetes/carbohydrate counting: count net carbs, maintain consistent carb distribution across meals, pair with protein and fat for moderation.
- Weight loss: choose lower energy-density fruits (berries, melon) and track portions; see Best Fruits for Weight Loss Guide for targeted selections.
For clarity on vegetable carb content relative to fruits see additional resources like Broccoli Nutrition Facts 100g and Serving Size Guide or Calorie Content of Cabbage and Nutritional Information Guide.
Seasonal and Regional Variations in Fruit Carbohydrate Content
Answer: Fruit carbohydrate content changes with ripeness and variety; seasonal and regional differences (including Texas varieties) can alter sugar concentration—riper and sun-exposed fruits tend to have higher available sugars and slightly higher net carbs.

Examples and experience-based observations:
- Peaches harvested at peak ripeness in Texas often register higher sugar and slightly increased total carbs compared with underripe samples from storage; anecdotal market sampling and USDA varietal ranges reflect this.
- Watermelons post-summer tend to be sweeter later in the season as sugar accumulates; this raises carbs per typical cup serving.
- Imported off-season fruit (e.g., winter strawberries) can have different sugar profiles due to cultivar and shipping time.
Practical list of seasonal patterns:
- Spring: early berries (moderate carbs, high fiber in raspberries/blackberries).
- Summer: peaches, melons and local berries (variable sugars, generally higher when fully ripe).
- Fall: apples and pears (higher total carbs per serving but also higher fiber in some varieties).
- Winter: citrus (oranges, grapefruit) with steady carb ranges but different textures and sweetness.
When using the chart, adjust values slightly higher for very ripe fruit—typically a 5–15% increase in available sugars depending on fruit and ripeness level. Always weigh and re-calculate if strict carb targets are required.
Myths and Facts About Fruit Carbohydrates
Answer: Common myths include “fruit sugars are as harmful as added sugars” and “all fruits spike blood sugar equally”; facts show fiber, matrix and portion size change impacts—many fruits are beneficial when consumed intelligently.
- Myth: “Fruit sugar is the same as table sugar.”
- Fact: Fruit sugars come with fiber, water and phytonutrients that slow absorption and provide health benefits; the Academy of Nutrition and Dietetics supports whole fruits as nutrient-dense carbohydrate sources (Academy of Nutrition and Dietetics).
- Myth: “You should avoid fruit on a low-carb diet.”
- Fact: Many low-carb approaches include small servings of low-net-carb fruits (berries, avocado) while limiting higher-net-carb fruits; portion control makes fruit compatible with many plans.
- Myth: “Dried fruit is as healthy as fresh fruit.”
- Fact: Drying concentrates sugars and carbs—dried fruit often has 3–4x the carbs per equal-weight serving; see Is Dried Fruit Good for You?.
- Myth: “Fiber doesn’t affect net carbs.”
- Fact: Soluble and insoluble fibers reduce net carbs and slow glucose absorption; research summarized by nutrition authorities shows fiber’s metabolic benefits.
Frequently Asked Questions about Carbs in Fruits
Answer: The following concise Q&A clarifies core terms, comparisons, and practical carb counts for common fruits to support quick planning and decision-making.