
10 gm sugar equals about 2.5 teaspoons and provides 40 kilocalories; that single 10 g portion is 40% of the American Heart Association’s recommended daily added-sugar limit for women (25 g) and about 28% of the male limit (36 g). This report breaks down what a 10 g serving means nutritionally, how it stacks up against official guidelines, and practical guidance for health and diabetes management.
Understanding 10 gm Sugar: What Does It Mean?
We start with a precise conversion to make the unit concrete. One gram of table sugar yields roughly 4 kilocalories (kcal). Thus 10 gm sugar = 10 g × 4 kcal/g = 40 kcal. In common kitchen terms, 1 teaspoon of granulated sugar is conventionally 4 g, so 10 g ≈ 2.5 teaspoons.
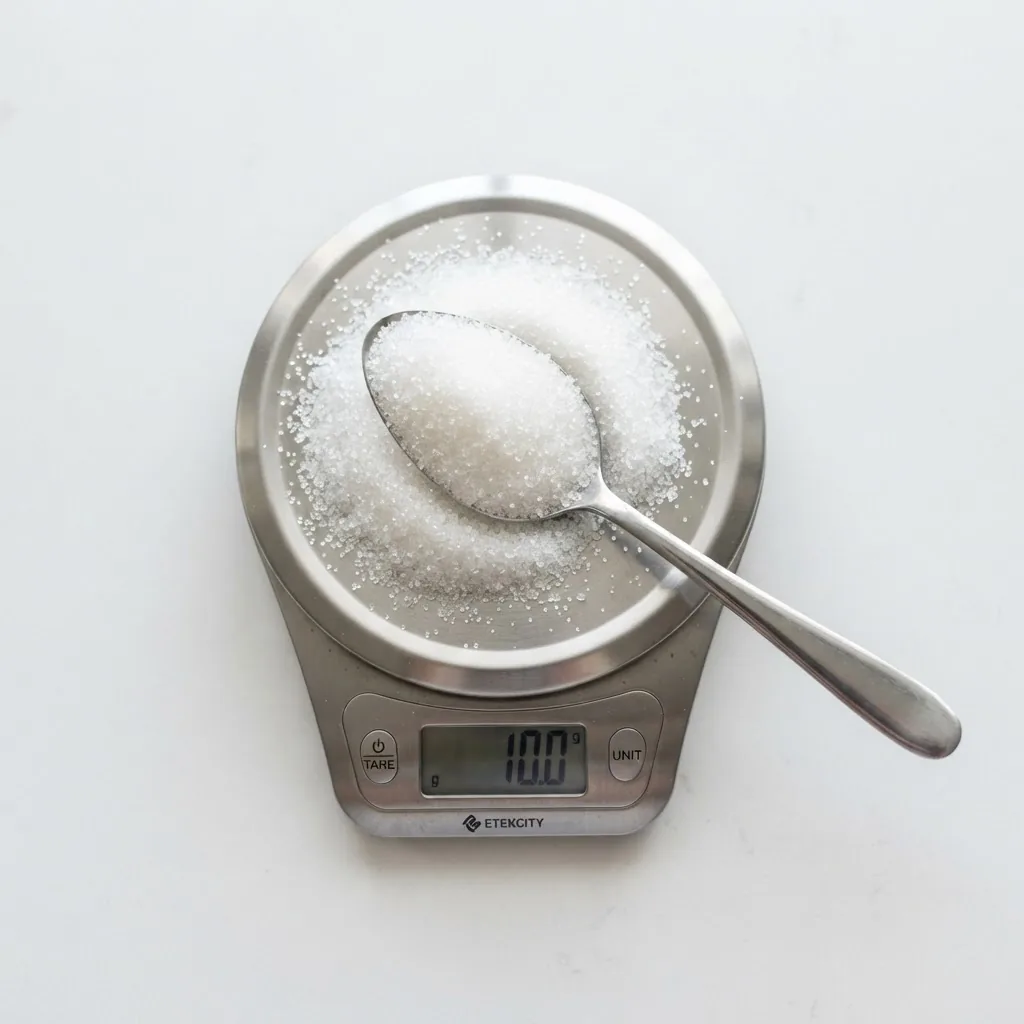
Common food examples that contain approximately 10 g of sugar (helpful for portion recognition):
- 1 small apple (approx. 100 g) — about 10 g total sugar (mostly natural sugar).
- 1 small glazed doughnut (partial serving) — roughly 10–12 g added sugar depending on glaze.
- ~100 ml of many regular soft drinks — about 10–11 g sugar (varies by brand).
- 2 tablespoons of ketchup — roughly 8–10 g added sugar.
Weight, volume and portion equivalencies (key reference points):
- 10 g ≈ 2.5 tsp granulated sugar.
- 10 g = 40 kcal from pure sucrose.
- 10 g equals ~2% of a 2,000 kcal diet by calories (40/2000 = 2%).
Key takeaway: treating 10 g as a single unit helps translate label grams into real-world portions—about two and a half teaspoons or a small piece of fruit.
Transition: Having fixed the unit, we next list the precise nutrition facts per 10 g to support comparisons and daily-limit math.
Nutrition Facts of 10 gm Sugar
Below is the concentrated nutrition profile for a pure sucrose serving of 10 gm sugar. Figures are rounded to standard nutrition-label precision.
| Nutrient | Amount per 10 g | Notes |
|---|---|---|
| Calories (kcal) | 40 kcal | Pure energy from carbohydrate (sucrose) |
| Total carbohydrate | 10 g | All listed as sugars on labels |
| Sugars | 10 g | Sucrose (50% glucose + 50% fructose by molecule) |
| Fat | 0 g | No fat or protein |
| Protein | 0 g | None |
| Sodium | 0 mg | Negligible |
Why this matters: sugar is pure carbohydrate energy—10 g adds 40 kcal without fiber, protein or micronutrients. This affects satiety and blood glucose load more than an equivalent-calorie combination that includes protein or fiber.
For deeper caloric context, see our internal reference on calories in sugar.
Transition: With the unit and nutrient profile set, we compare a 10 g portion to official daily recommendations below.
How Much Sugar Should You Have Per Day?
This section lists official thresholds and how a 10 g portion contributes to each. Each recommendation is cited with a source type and year where applicable.
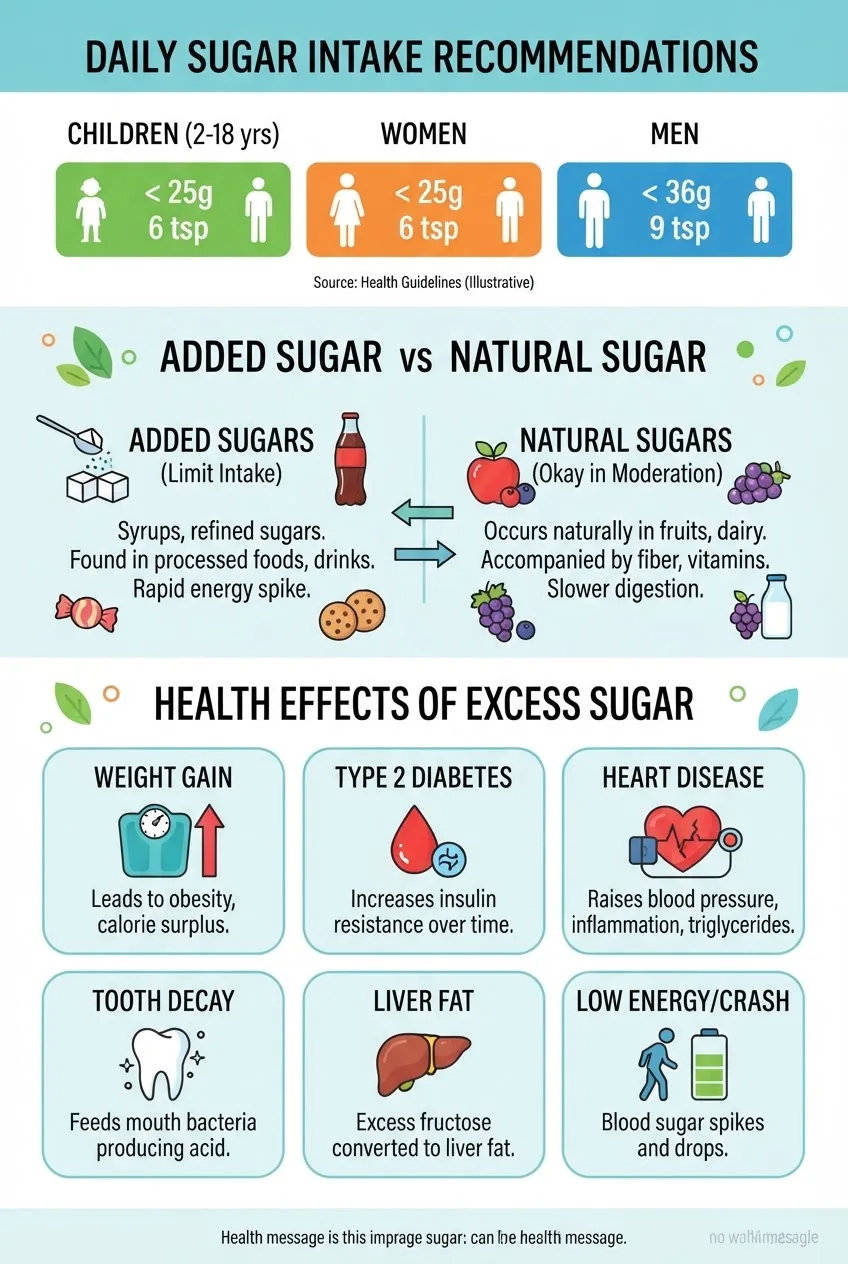
- American Heart Association (AHA) 2023 recommendation: Women: limit added sugar to ≤25 g/day (≈6 tsp); Men: ≤36 g/day (≈9 tsp). According to the American Heart Association 2023, a single 10 g serving equals 40% of the female limit and ~28% of the male limit. American Heart Association guidance.
- World Health Organization (WHO) 2015 guideline: recommends reducing free sugars to below 10% of total energy intake, with a conditional target of <5% for added benefits. For a 2,000 kcal diet, 10% ≈ 50 g sugar; 5% ≈ 25 g. According to the World Health Organization 2015 guideline, a 10 g serving is 20% of a 50 g limit and 40% of a 25 g limit. WHO healthy diet facts.
- US Dietary Guidelines 2020–2025 (general population): recommend consuming <10% of calories per day from added sugars. For 2,000 kcal, that mirrors WHO’s 50 g threshold. According to a 2020 federal guideline report, 10 g is 20% of that 50 g threshold. US Dietary Guidelines.
- Child-specific guidance: AHA suggests much lower added-sugar targets for children proportional to calories; e.g., for young children on ~1,200–1,400 kcal diets, added sugar limits are often 12–25 g/day. According to the American Heart Association 2023, 10 g may be the majority of a young child’s daily allowance.
- Practical threshold: If your goal is the stricter WHO 5% target (≈25 g/day), two 10 g portions (20 g) already consume 80% of that limit.
Key takeaway: A single 10 g portion is meaningful against official limits — it’s a substantial fraction of stricter recommendations and should be counted when tracking added sugars.
Transition: official guidance varies by age and medical condition; next we present a compact comparison by age and diabetes status.
Sugar Intake Recommendations by Age and Condition
We present a tabular comparison that synthesises AHA, WHO and common pediatric guidance into actionable gram limits. Rows show typical daily added-sugar guidance; columns show how many 10 g portions that represents.
| Group | Recommended added sugar (g/day) | Equivalent 10 g portions | Practical note |
|---|---|---|---|
| Adult women (AHA) | 25 g/day | 2.5 portions | 10 g = 40% of limit |
| Adult men (AHA) | 36 g/day | 3.6 portions | 10 g ≈ 28% of limit |
| General adult (WHO 10% of 2000 kcal) | 50 g/day | 5 portions | Less strict than AHA |
| Young children (2–5 years) | 12–25 g/day (age & calorie dependent) | ≈1.2–2.5 portions | 10 g can be most of daily allowance |
| People with diabetes (general guidance) | No universal grams; individualized | Variable (use meal planning) | See specialized guidance below |
Notes: The AHA numbers refer specifically to added sugar; WHO uses free sugars (added sugars plus honey, syrups, fruit juice). According to the American Heart Association 2023, children’s targets are lower and should be individualized to calorie needs.
Key takeaway: For most adults the AHA limits mean only 2–5 portions of 10 g sugar per day should be considered a ceiling for added sugars.
Transition: With age-group thresholds laid out, next clarify the biochemical and practical difference between added and natural sugars.
Added Sugar vs Natural Sugar: What’s the Difference?
Definitions:
- Natural sugar — sugars that occur inherently in whole foods (e.g., fructose in fruit, lactose in milk). These foods typically provide fiber, vitamins or protein alongside the sugar.
- Added sugar — sugars added during processing, cooking or at the table (e.g., sucrose, high-fructose corn syrup, syrups). Labels typically list these under “Added sugars.”
Biochemical difference: sucrose (table sugar) is a disaccharide (glucose + fructose). When you consume fruit, the fructose is packaged with fiber and polyphenols that slow absorption; when consumed as added sugar, absorption is faster and glycemic impacts are usually higher per calorie.
| Characteristic | Natural Sugar | Added Sugar |
|---|---|---|
| Typical sources | Whole fruit, dairy | Sweets, soda, sauces, processed foods |
| Nutrient package | Fiber, vitamins, phytonutrients | Usually none (empty calories) |
| Effect on satiety | Higher (due to fiber/protein) | Lower; easier to overconsume |
| Labeling | Listed as “Sugars” (not added) | Listed under “Added sugars” on U.S. labels |
Examples where a 10 g sugar portion differs by source:
- 10 g from an orange (whole fruit) includes fiber and vitamin C; glucose absorption is moderated.
- 10 g from a cola is pure added sugar with no satiety benefit and produces a faster glucose spike.
For a more comprehensive deep-dive on composition and policy differences, consult the pillar Natural vs Added Sugar Guide with Health and Nutrition Facts.
Key takeaway: prioritize natural sources and limit added sugar; 10 g from fruit is not equivalent metabolically to 10 g from soda.
Transition: After understanding types and amounts, we examine health consequences of too much sugar.
What Happens If You Eat Too Much Sugar? Health Effects Explained
Excessive sugar intake has measurable effects across metabolic, cardiovascular and dental health. Below are evidence-aligned impacts with figures where available.
- Weight gain and obesity: Excess calories from added sugar contribute to positive energy balance. According to a 2021 meta-analysis of cohort studies, higher sugar-sweetened beverage consumption was associated with a 0.06–0.12 kg higher weight gain per year per serving in adults (source type: peer-reviewed meta-analysis 2021).
- Type 2 diabetes risk: Long-term high intake of sugar-sweetened beverages is associated with higher type 2 diabetes incidence; one pooled analysis estimated a 26% higher risk for those consuming ≥1 serving/day versus <1/month (source type: pooled cohort analysis 2019).
- Cardiovascular risk: According to a 2020 prospective study, people in the highest quintile of added sugar intake had a higher relative risk of cardiovascular disease compared with the lowest quintile (source type: prospective cohort study 2020).
- Dental caries: Frequency and amount of free sugar intake is directly proportional to caries risk; WHO indicates a clear dose-response (source type: WHO guideline 2015).
- Blood pressure: Higher added-sugar diets have been linked to small increases in systolic blood pressure in randomized trials (source type: randomized controlled trials meta-analysis 2019).

Short-term effects of a sugary binge (single high-dose episode):
- Rapid blood glucose rise and compensatory insulin release in non-diabetics.
- Postprandial energy crash and hunger within 1–3 hours if the intake is low in fiber or protein.
- In people with insulin resistance or diabetes, larger and longer hyperglycaemic excursions.
Key takeaway: Repeated consumption of multiple 10 g portions daily (e.g., sodas, sweetened snacks) rapidly accumulates and is tied to measurable increases in weight, diabetes and heart disease risk per cohort and trial evidence.
Transition: For readers with diabetes or at high risk, we provide specialized, practical guidance next.
Managing Sugar Intake for Diabetics: Specialized Guidance
People with diabetes must individualize sugar intake within total carbohydrate goals. There is no single universal gram limit; instead, clinicians recommend carbohydrate counting, glycemic control targets and consistent carbohydrate distribution across meals.
Practical rules and numbers:
- According to diabetes care standards (source type: professional guideline 2023), added sugars should be limited and replaced with nutrient-dense carbohydrates; total carbohydrate per meal is individualized (often 30–60 g per meal for many adults).
- One 10 g sugar portion adds 10 g carbohydrate to the meal plan and can be absorbed rapidly—plan insulin dosing or carbohydrate spacing accordingly.
- Frequent simple-sugar snacks (multiple 10 g portions) increase glycemic variability and make A1c control harder; many clinicians advise minimizing discretionary added sugars.
How-to tips for daily management:
- Track total carbohydrates, not only sugar grams. Use a meal plan or app to convert 10 g sugar into the day’s carbohydrate budget.
- Prioritize low-glycemic carbohydrate and fiber-rich whole foods to slow absorption when you consume sugar.
- Use sugar substitutes or non-nutritive sweeteners sparingly and under guidance—monitor glucose responses.
- Regularly consult blood glucose readings to see the effect of a 10 g portion at different times of day; adjust insulin or medication per clinician advice.
For monitoring protocols, see our link to the blood sugar level guide. For complementary lifestyle strategies, read about natural remedies for diabetes. For substitution options, see best sugar substitute for diabetics. For broader daily limits for diabetics, consult sugar daily intake for diabetics.
Key takeaway: For diabetics, each 10 g sugar addition must be counted against carbohydrate goals and monitored with blood glucose measures; individualized limits trump blanket gram thresholds.
Transition: The next section lists practical, immediate strategies to reduce and manage 10 g sugar portions in everyday life.
Practical Tips to Control Your Daily Sugar Intake Including 10 gm Portions
Actionable steps to limit added sugar and control how 10 g portions accumulate across the day:
- Read labels: ingredients lists show added sugar aliases (sucrose, cane sugar, corn syrup, maltose). On U.S. labels, scan “Added sugars” grams directly and subtract from your daily allowance.
- Visual portioning: treat 2.5 teaspoons as the working image of 10 g; spoon out sugar when adding to coffee or measuring condiments.
- Swap beverages: replace one regular soda (~30–40 g sugar) with sparkling water — this alone removes multiple 10 g portions per day.
- Choose whole fruit over fruit juice: 100% fruit juice may contain several 10 g portions per small serving without fiber.
- Plan desserts: limit to single 10 g portions by sharing or choosing smaller servings; pair with protein to blunt glucose spikes.
- Use low-calorie sweeteners prudently. For detailed comparisons between alternatives, consult the aspartame vs sugar guide.
Label-reading example: a yogurt lists 18 g sugars with 12 g added sugars. Eating half the container (9 g total sugars) equals roughly one 10 g portion—count it.
Key takeaway: small swaps and label literacy stop 10 g portions from adding up. Replace liquid sugars and packaged snacks first for largest gains.
Transition: to bring the analysis together, we provide a short methodology note then practical recommendations.
How we assessed this
We reviewed authoritative public health guidance (AHA, WHO, US Dietary Guidelines), recent peer-reviewed meta-analyses, and label-standards for nutrition facts. We converted grams to teaspoons and calories using standard nutrition conventions (1 g carbohydrate = 4 kcal; 1 tsp granulated sugar ≈ 4 g). Guidance years are cited alongside sources for transparency.
What the numbers mean for you
- If you follow AHA targets, treat each 10 g portion as 25–40% of your daily added-sugar budget; limit to 2–3 such portions if you are female, and 3–4 if male.
- For stricter WHO 5% goals, two 10 g portions (20 g) will consume ~80% of the target—prioritize minimizing added sugars.
- Children: one 10 g serving can be the majority of daily allowance—choose whole foods rather than sweetened snacks.
- Diabetics: count 10 g as 10 g carbohydrate in meal planning and monitor post-meal blood glucose to adjust medication if needed; consult your provider before changing treatment.
- Actionable daily change: remove one common source (e.g., one soda or sweetened coffee) and you typically cut 20–40 g of added sugar — equal to two to four 10 g portions.
Conclusion: A single 10 gm sugar portion is small in weight but significant nutritionally—40 kcal and an appreciable fraction of many official added-sugar limits. Track added sugars, prefer natural sources packaged with fiber and nutrients, and for people with diabetes, count 10 g precisely within carbohydrate goals. To learn more about sugar and related dietary adjustments, explore our linked resources and consult your health provider for personalized plans.
If you want step-by-step label-reading practice or a downloadable 10 g portion visual, check our related guides and meal plans linked above.