
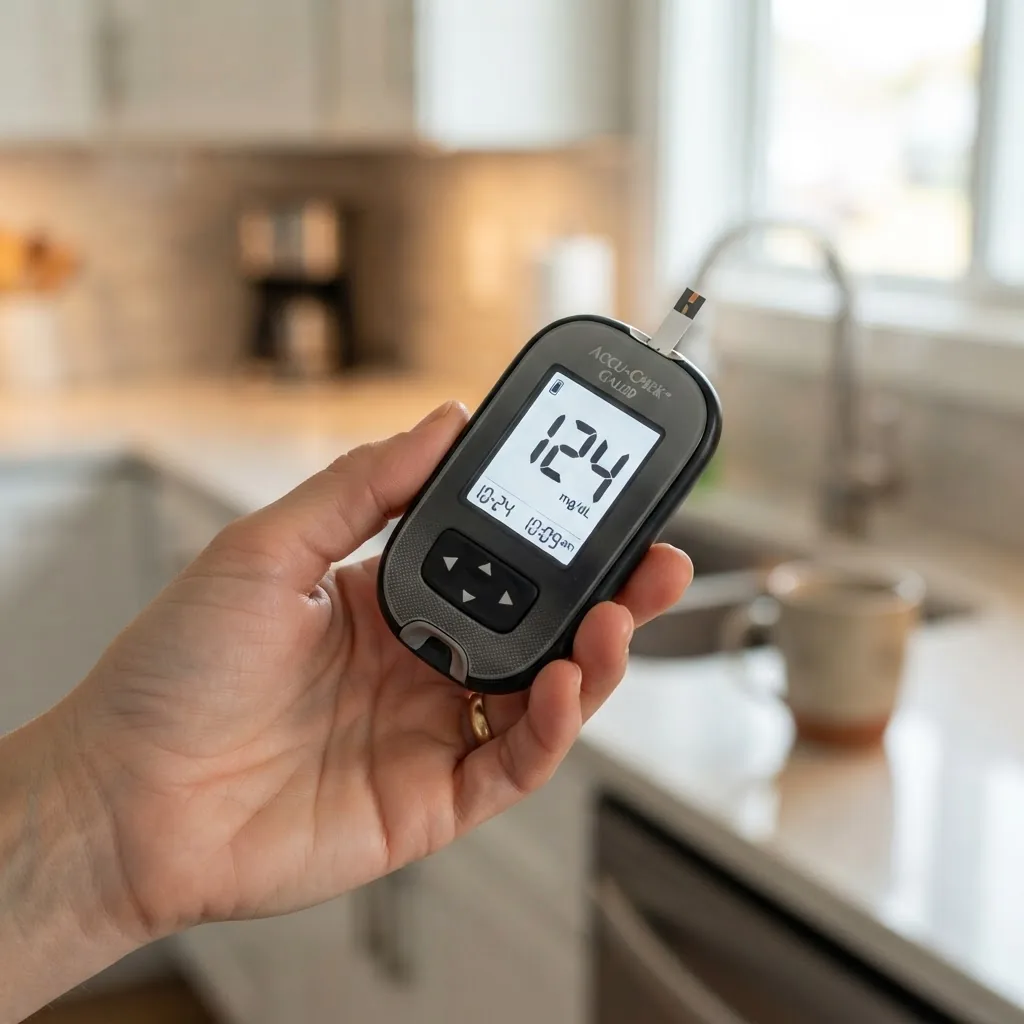
Short answer: A single reading of 124 mg/dL can be normal or indicate prediabetes depending on context — fasting vs postprandial matters. Confirm with a proper fasting blood sugar test, A1c, or glucose tolerance test and follow up with monitoring and clinical assessment to determine diabetes risk.
Understanding Blood Sugar Levels: What Does 124 Mean?
Direct answer: A blood glucose level of 124 mg/dL can be a borderline elevated fasting value (consistent with prediabetes if fasting) or a normal postprandial (after eating) reading; interpretation requires knowing the timing and repeat testing.
Term: Fasting blood sugar test — a lab or at-home measurement taken after at least 8 hours without calories to assess baseline blood glucose.
A lab result of 124 mg/dL must be interpreted by context. Reference ranges commonly used by clinicians are:
- Normal fasting blood glucose: 70–99 mg/dL
- Prediabetes (fasting): 100–125 mg/dL
- Diabetes (fasting): ≥126 mg/dL on two separate tests
These ranges are the standard framing clinicians use to interpret a single fasting blood sugar measurement. If 124 mg/dL was measured fasting, it falls in the prediabetes blood sugar range (100–125 mg/dL) and warrants follow-up testing.
Term: Postprandial blood sugar — blood glucose measured 1–2 hours after starting a meal; values up to about 140 mg/dL can be normal in many people.
Important caveats:
- One elevated reading does not equal a diabetes diagnosis; blood sugar fluctuates daily with food, activity, stress, and illness.
- If 124 mg/dL was measured as a random (non-fasting) reading, it may be harmless — but if you suspect regular elevation, arrange formal testing.
How clinicians confirm a diagnosis: they use diagnostic criteria such as a repeat fasting glucose, a Hemoglobin A1c (A1c) blood test, or a 2-hour oral glucose tolerance test (OGTT). For diagnostic thresholds and clinical guidance, see the American Diabetes Association guidelines. American Diabetes Association.
Practical next steps after a 124 mg/dL reading:
- Note the timing (fasting, 1–2 hours after eating, or random).
- Repeat the fasting blood sugar test on a different morning or order an A1c through your clinician.
- Begin routine blood sugar monitoring if advised by your clinician and track patterns.
Below we provide a full explanation of how a 124 blood sugar reading compares to other values (like a blood glucose level of 90) and what to do next, including local context for Texas prevalence and resources.
Comparing 124 Blood Sugar to a Blood Glucose Level of 90
Direct answer: 90 mg/dL is a typical normal fasting blood glucose; 124 mg/dL is near the top of the prediabetes fasting range — their clinical meaning depends on whether readings were fasting or postprandial.
Term: Blood glucose mg/dL — the unit used to express blood sugar concentration in the United States: milligrams per deciliter.
-
Fasting context — If both are fasting:
- 90 mg/dL = clearly normal (70–99 mg/dL).
- 124 mg/dL = prediabetes (100–125 mg/dL), raising risk for type 2 diabetes without interventions.
-
Random/non-fasting context — Measured at any time:
- 90 mg/dL = well within typical random range; low hypoglycemia risk unless symptomatic.
- 124 mg/dL = commonly normal after meals but could reflect insufficient insulin action if high consistently.
-
Postprandial (1–2 hours after eating) — If readings are post-meal:
- 90 mg/dL = unusually low postprandial level, often indicating good glucose control.
- 124 mg/dL = generally acceptable; many guidelines consider <140 mg/dL acceptable at 2 hours post-meal for non-diabetics.
-
Implications for symptoms — If you experience blood sugar symptoms (weakness, excessive thirst, frequent urination):
- 90 mg/dL rarely explains hyperglycemic symptoms.
- 124 mg/dL may correspond to mild hyperglycemia symptoms for some people but is often asymptomatic.
-
Monitoring recommendations — For single elevated fasting readings like 124 mg/dL:
- Repeat fasting test or order an A1c to evaluate average glucose over 2–3 months.
- Track with a glucose meter: fasting, pre-meal, and 1–2 hours post-meal for a week to see patterns.
| Measure | 90 mg/dL | 124 mg/dL |
|---|---|---|
| Fasting interpretation | Normal | Prediabetes range |
| Postprandial (1–2 hr) | Low-normal | Typically acceptable |
| Immediate action | Routine monitoring | Repeat testing & lifestyle review |
Use a reliable glucose meter and note meal timing to ensure valid comparisons. For meter technique guidance, see the step-by-step home measurement walkthrough later in this article.
Blood Sugar Levels and Diabetes Diagnosis: What Is the Diabetes Count?
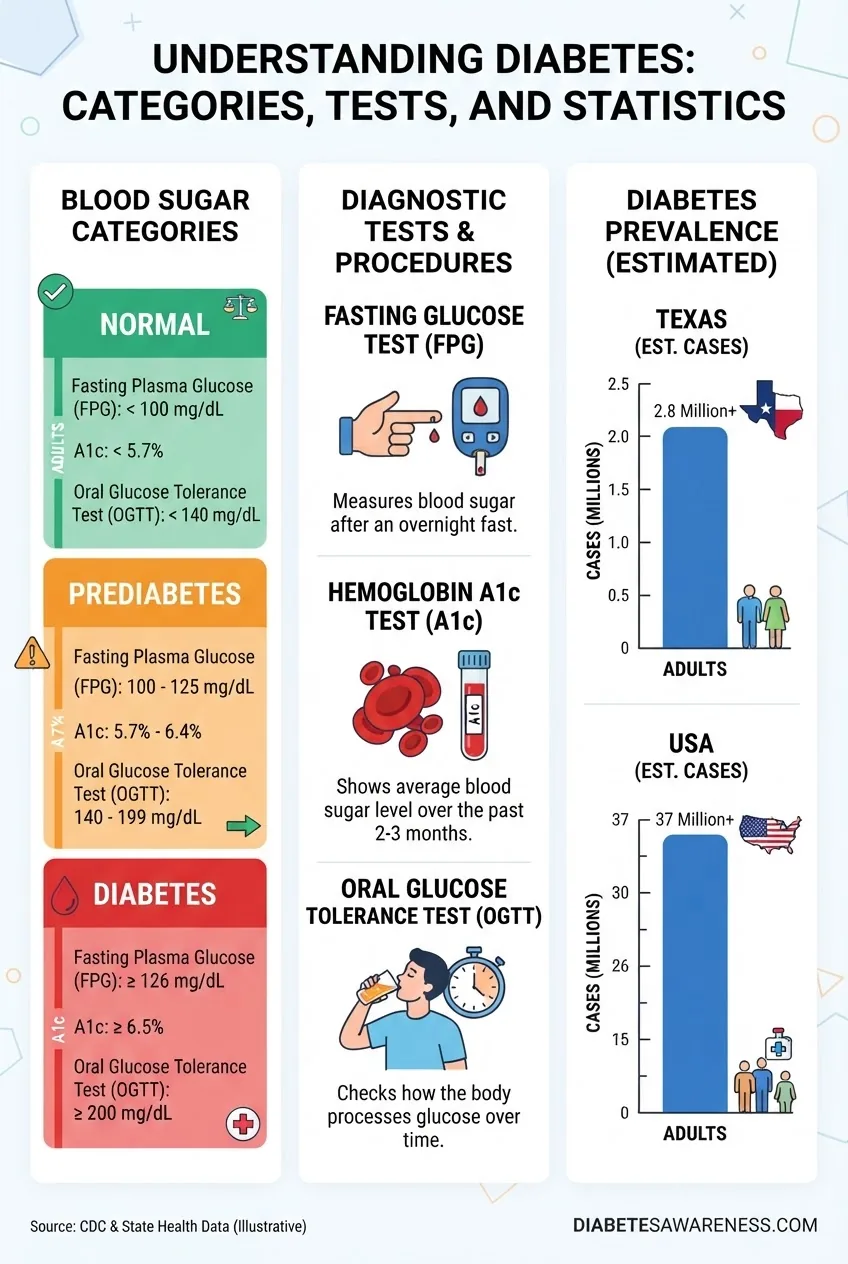
Direct answer: “Diabetes count” refers to the number of people diagnosed or estimated to have diabetes; diagnosis uses criteria (A1c ≥6.5%, fasting glucose ≥126 mg/dL, or 2-hour OGTT ≥200 mg/dL). Prevalence and incidence data quantify the diabetes count regionally and nationally.
Term: Diabetes diagnosis criteria — standardized thresholds (A1c, fasting glucose, OGTT) clinicians use to determine diabetes.
Official diagnostic thresholds used by clinicians:
- Fasting plasma glucose: diabetes if ≥126 mg/dL on two separate days.
- Hemoglobin A1c: diabetes if ≥6.5% (A1c measures average blood glucose over ~3 months).
- Oral glucose tolerance test (2-hour): diabetes if ≥200 mg/dL after 75 g glucose.
These thresholds are aligned with major clinical guidance. For the ADA’s formal diagnostic criteria, see the American Diabetes Association guidance. American Diabetes Association.
How “diabetes count” is reported:
- Prevalence: the total number of people living with diabetes at a given time.
- Incidence: the number of new diabetes cases in a period (usually per year).
- Diagnosed vs undiagnosed: counts often separate known cases (diagnosed) from model-estimated undiagnosed cases.
Current statistics and Texas-specific data:
According to a 2024 CDC report, approximately 37.3 million people in the United States — roughly 11.3% of the population — have diagnosed diabetes; an estimated additional 8.5 million have prediabetes but are undiagnosed. CDC diabetes statistics.
According to a 2023 state health data report, Texas ranks among the states with higher counts of diagnosed diabetes, with prevalence varying by county and demographic factors. For example, certain counties report adult diagnosed diabetes prevalence above the national average, driven by factors such as obesity rates and access to care. For state-level breakdowns, consult the CDC and Texas Department of State Health Services data. CDC.
Term: Hemoglobin A1c (A1c) — a blood test reflecting average glucose over the prior 2–3 months, reported as a percentage.
Case study (anonymized example showing diagnosis workflows):
Example: A 48-year-old Texan had a fasting blood sugar of 124 mg/dL at a health fair. Their clinician ordered an A1c (6.0%) and a repeat fasting glucose the next week (122 mg/dL). The results indicated prediabetes, prompting lifestyle interventions and quarterly monitoring. This sequence shows how single readings contribute to a diabetes count only after confirmation.
How counts translate into care:
- People identified in the prediabetes range receive counseling, diet/exercise programs, and sometimes medications (e.g., metformin) depending on risk.
- Confirmed diabetes cases enter structured care pathways: glycemic targets, cardiovascular risk management, and monitoring for complications.
Why counts matter for public health:
- High diabetes counts drive resource allocation for prevention programs, especially in states like Texas with diverse and large populations.
- According to a 2023 CDC report, targeted prevention (lifestyle programs) effectively reduces progression from prediabetes to diabetes in many settings. CDC Diabetes Prevention.
Factors That Can Affect Your Blood Sugar to Reach 124
Direct answer: Diet (especially high glycemic index foods), physical inactivity, stress, illness, certain medications, and insulin resistance are common factors that can push blood glucose to 124 mg/dL or higher.
-
Diet impact — High-carbohydrate, high glycemic index foods cause faster glucose rises; portion size and meal composition (fat/protein) modify spikes.
Term: Glycemic index — a ranking of how quickly foods raise blood glucose compared to glucose itself.
- Physical activity — Low activity reduces glucose uptake by muscles; exercise improves insulin sensitivity and lowers typical readings.
- Insulin resistance overview — Insulin resistance means cells respond poorly to insulin, so more glucose remains in the blood; it’s a central cause of elevated fasting glucose.
- Medications and substances — Steroids, some antipsychotics, certain HIV drugs, and high-dose niacin can raise blood sugar.
- Stress and hormones — Acute stress increases cortisol and adrenaline, which raise blood glucose temporarily.
- Illness and infection — Illness often elevates glucose because stress hormones promote higher blood sugar.
- Sleep and circadian effects — Poor sleep and shift work can impair glucose regulation and raise fasting glucose.
- Recent food or drink — A blood sugar reading taken within two hours of a carbohydrate-containing meal is expected to be higher than fasting; dehydration can also concentrate blood glucose slightly.
- Measurement technique — Incorrect meter technique or expired test strips can give inaccurate readings—see the home measurement walkthrough below for correct steps.
How to Manage Blood Sugar Levels Around 124 MG/DL
Direct answer: Manage a 124 mg/dL reading by confirming fasting status, repeating tests (fasting glucose and A1c), adopting diet/exercise changes, monitoring regularly, and consulting a clinician for personalized plans; medication may be considered if risk is high.
Term: Blood sugar monitoring — routine checking of blood glucose using a meter or continuous glucose monitor to track levels and trends.

- Confirm the reading — Repeat a fasting blood sugar test the next morning or schedule lab testing; consider ordering an A1c to measure longer-term control.
-
Begin routine monitoring — Use a reliable glucose meter: check fasting, before meals, and 1–2 hours after meals for pattern recognition.
How to measure at home (walkthrough):
- Wash and dry hands; prepare meter and fresh test strip.
- Prick the side of a fingertip with a lancet, squeeze gently for a drop.
- Apply blood to the strip per meter instructions; record result with date/time and meal context.
- Dispose of lancet safely; log results in a notebook or app.
- Dietary changes — Prioritize low-glycemic-index carbohydrates, fiber, lean protein, and healthy fats to blunt postprandial spikes.
- Exercise — Aim for at least 150 minutes per week of moderate aerobic activity plus resistance training; exercise increases muscle glucose uptake and improves insulin sensitivity.
- Weight and body composition — Reducing visceral adiposity (belly fat) improves insulin resistance; combine caloric control with strength training for best results.
- Consider medication if indicated — If repeat testing confirms diabetes, clinicians may start medications (metformin first-line for many). Discuss risks/benefits with your clinician and consider specialist referral if needed.
- Try evidence-based complementary options — Some people explore lifestyle-focused natural approaches alongside medical care; see resources on natural remedies for blood sugar management for complementary strategies, but always coordinate with your clinician.
- Set realistic glycemic goals — Work with your clinician on individualized targets (A1c, fasting and postprandial goals) based on age, comorbidities, and hypoglycemia risk.
- Follow-up cadence — For prediabetes-range fasting readings, many clinicians recommend testing every 3–6 months and lifestyle intervention; for confirmed diabetes, follow-up may be every 3 months initially.
Additional resources within this site for practical diet choices and substitutes:
- Natural vs Added Sugar Guide with Health and Nutrition Facts
- artificial sweeteners compared to sugar
- best sugar substitutes for blood sugar control
- natural remedies for blood sugar management
- foods that support healthy metabolism
When to See a Doctor or Get Further Testing
Direct answer: See a clinician for repeat fasting blood sugar, an A1c, or an OGTT after an elevated 124 mg/dL fasting result; seek urgent care if you have emergency symptoms (very high glucose, confusion, vomiting, rapid breathing).
Checklist: symptoms and actions
- If you have fasting 124 mg/dL: schedule repeat fasting glucose and an A1c within 1–4 weeks.
- If you experience increased thirst, frequent urination, unexplained weight loss, or blurred vision: contact your clinician promptly.
- Emergency signs (go to ER): very high glucose symptoms, difficulty breathing, severe abdominal pain, persistent vomiting, confusion — possible diabetic ketoacidosis or hyperosmolar hyperglycemic state.
Follow-up testing and timelines:
- Repeat fasting glucose on a different day to confirm an elevated value.
- Order Hemoglobin A1c to assess longer-term control (A1c ≥6.5% = diagnostic for diabetes).
- Consider a 2-hour OGTT if initial tests are inconclusive or if gestational diabetes is a concern.
Trust signals: one elevated home reading is not a diagnosis — according to the American Diabetes Association criteria and common clinical practice, diabetes diagnosis requires confirmatory testing. American Diabetes Association.
Links Between Sugar Intake and Blood Sugar Levels
Direct answer: Added sugars and high-glycemic carbohydrates can raise blood glucose quickly, while natural sugars in whole foods (fruits) have different effects due to fiber, fat, and protein; choosing low-glycemic, fiber-rich foods helps keep readings like 124 mg/dL from rising further.
Natural vs added sugar: whole fruit contains fiber and micronutrients that blunt glucose response; added sugars (sodas, sweets) are rapidly absorbed and more likely to cause spikes. See our Natural vs Added Sugar Guide with Health and Nutrition Facts for a deeper look.
Artificial sweeteners and substitutes:
Compared to sugar, many artificial sweeteners have minimal direct impact on blood glucose, but individual responses and long-term metabolic effects vary. For direct comparisons, see artificial sweeteners compared to sugar and options in best sugar substitutes for blood sugar control.
Practical guidance:
- Reduce intake of sugar-sweetened beverages and refined carbs to prevent postprandial spikes.
- Choose whole grains, legumes, vegetables, and fruits with fiber to lower glycemic load.
- Limit added sugars in line with daily sugar intake recommendations.
For a deeper primer on how sugar types influence health and blood sugar, read our pillar page: Natural vs Added Sugar Guide with Health and Nutrition Facts.
For alternatives that may reduce glycemic impact, consult best sugar substitutes for blood sugar control.
Note: while reducing sugar lowers spikes, total carbohydrate, portion sizes, meal timing, and physical activity are equally important for managing fasting and postprandial readings such as 124 mg/dL. For foods that immediately lower blood sugar and specific meal plans, see related articles in our nutrition and diabetes categories.
Final takeaways: A 124 blood sugar level needs context — fasting values suggest prediabetes, while non-fasting values may be acceptable; confirm with repeat testing and follow evidence-based lifestyle changes or medical care to reduce progression risk.