
Answer: Granulated table sugar contains about 4 kilocalories per gram (commonly rounded to 4 kcal/g), so a teaspoon (~4.2 g) has ~17 kcal and a tablespoon (~12.6 g) has ~50 kcal; exact values vary slightly by sugar type and USDA entries. This guide details those numbers and health implications.
What are “Understanding Calories in Sugar” and how many calories does sugar contain?
Answer: Sugar provides roughly 4 kcal per gram across common sugars; measurable servings translate to about 16–50 kcal depending on teaspoon/tablespoon portions. Below we define the measurement basics and show practical examples used in diet planning.
Term: calorie (food calorie or kilocalorie): the amount of energy needed to raise 1 kilogram of water by 1°C; nutrition labels use kilocalories (kcal).
Sugar’s caloric value is calculated using standardized energy factors (Atwater factors), which assign ~4 kcal per gram for digestible carbohydrates including sugars. That means weight in grams × 4 = approximate kcal from sugar. Exact reported values on food databases may differ slightly due to moisture and trace nutrients.
- Typical conversions: 1 teaspoon granulated sugar ≈ 4.2 g → ≈ 17 kcal.
- 1 tablespoon granulated sugar ≈ 12.6 g → ≈ 50 kcal.
- 100 g sucrose (table sugar) ≈ 387 kcal in USDA listings (2023), reflecting measurement specifics.
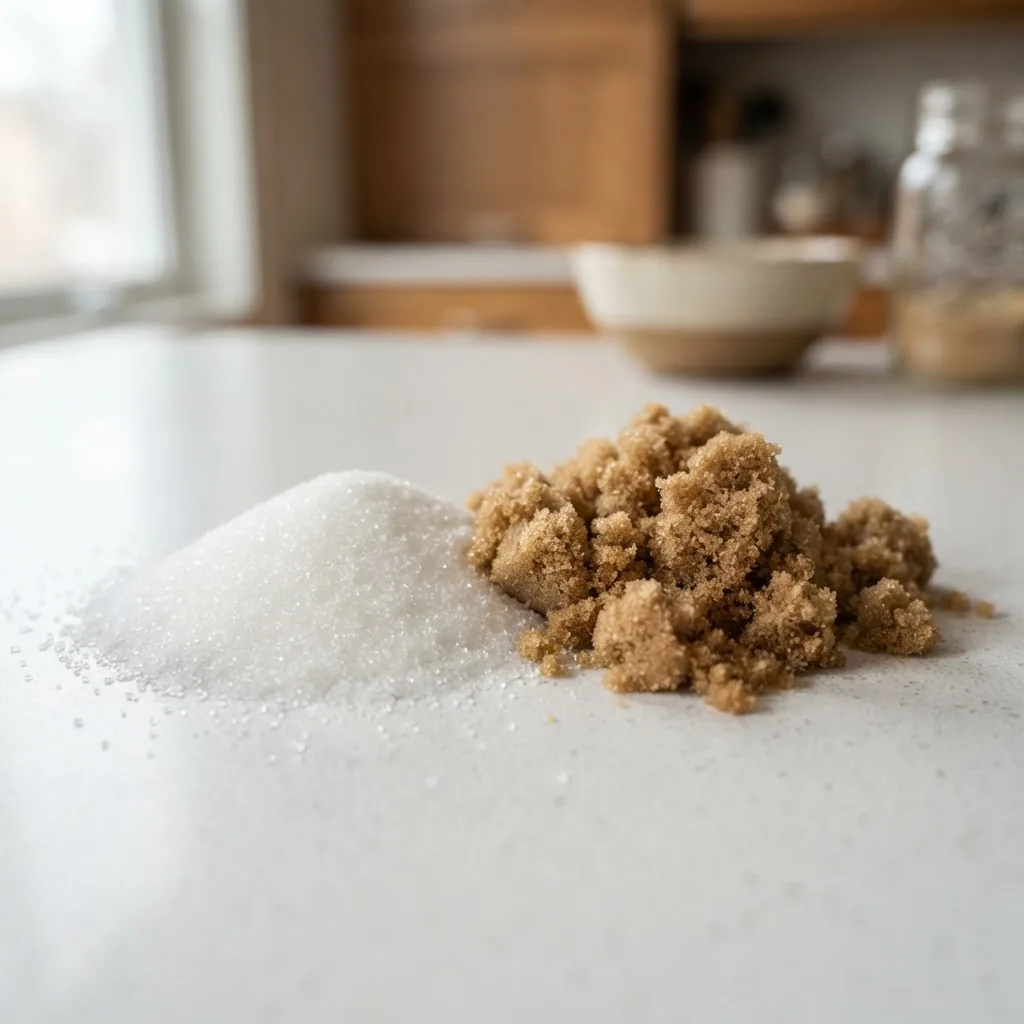
Practical scenario (Texas morning): a 12‑oz sweetened coffee with two teaspoons (~8.4 g) of sugar adds ~34 kcal just from sugar—small amounts add up when drinks and packaged foods are considered.
According to the 2023 USDA Nutrient Database, values recorded per 100 g differ slightly from simple multiplication because laboratory-tested samples include moisture and trace compounds; use Atwater’s 4 kcal/g as a quick calculation and USDA entries for precise labeling and nutrition facts.
Transition: Now that you know basic counts and measuring logic, read on for a full nutritional breakdown of sugar and how types differ.
What is the nutritional content of sugar and how should I read sugar nutrition facts?
Answer: Pure sugars are essentially carbohydrate (disaccharides or monosaccharides) with negligible protein, fat, vitamins, or minerals; their nutrition profile is dominated by digestible carbs supplying ~4 kcal/g and no significant micronutrients unless part of whole foods (e.g., fruit, honey).
Term: carbohydrate: a macronutrient that includes sugars, starches, and fiber; in sugar, carbohydrates are mostly simple sugars digestible for quick energy.
Below is a compact nutritional breakdown for plain granulated sucrose (table sugar) reflecting mass composition and energy. Values are representative and reference USDA-tested numbers (see source citations in-text).
| Component | Per 100 g (approx.) | Notes |
|---|---|---|
| Total carbohydrates | ~100 g | Almost entirely sugars (sucrose) |
| Calories (kcal) | ~387 kcal | USDA reported energy for sucrose (2023) |
| Protein | 0 g | Negligible |
| Fat | 0 g | Negligible |
| Vitamins & minerals | Trace | Negligible in refined sugar |
Interpretation: sugar’s “nutrition facts” on packaged foods list carbohydrate grams and calories; because micronutrients are absent, sugar contributes energy only. Whole-food sugars (fruit, dairy) include fiber, vitamins, and minerals and therefore a different nutrition profile.
Term: natural vs added sugar — natural sugars occur intrinsically in foods (e.g., fruit), added sugars are those incorporated during preparation or processing.
For a deeper look at differences between intrinsic and added sugars and health context, see the detailed guide on natural vs added sugar.
Transition: With composition clear, next we compare calorie counts across common sugar types and liquid sweeteners used in Texas kitchens and nationwide.
How many calories are in different types of sugar and sweeteners?
Answer: Most simple sugars (sucrose, glucose, fructose) provide about 4 kcal/g; liquid sweeteners (honey, maple syrup) provide similar or slightly higher kcal per tablespoon because of density and water content—use USDA entries for precise serving values.

Below is a comparison table of representative calorie values per common household measures. Values use Atwater approximations and note typical USDA-reported figures where available (2023 database referenced).
| Sweetener | Per gram (kcal) | Per teaspoon | Per tablespoon | Notes / Source |
|---|---|---|---|---|
| Sucrose (table sugar) | ~4 kcal/g | ~17 kcal (4.2 g) | ~50 kcal (12.6 g) | USDA Nutrient Database (2023) – sucrose ≈387 kcal/100 g |
| Glucose (dextrose) | ~4 kcal/g | ~16 kcal (4 g) | ~48 kcal (12 g) | Metabolically different but similar energy density |
| Fructose | ~4 kcal/g | ~16 kcal | ~48 kcal | Sweetest per gram; metabolism differs |
| Honey | ~3.0 kcal/g (density higher) | ~21 kcal (1 tsp ~7 g) | ~64 kcal (1 tbsp ~21 g) | USDA entries (2023): higher kcal/tablespoon due to density |
| Maple syrup | ~2.6–2.7 kcal/g | ~13–16 kcal (1 tsp ~5 g) | ~52 kcal (1 tbsp ~20 g) | USDA data: liquid sugars vary by water content |
Explanation: Differences between honey, maple syrup, and dry sugars arise from density and water percentage; honey’s tablespoon weighs ~21 g versus granulated sugar’s ~12.6 g, so calories per tablespoon differ despite similar kcal/g estimates for the sugar component.
Scientific nuance: while energy density is similar, fructose and glucose follow different metabolic routes—fructose is preferentially metabolized in the liver which affects downstream lipid synthesis (see peer-reviewed studies below).
Transition: Calories per gram are foundational; next, we explain their significance to weight management and metabolism with calculation examples and Atwater factor context.
How many calories per gram of sugar matter for diet and health?
Answer: Because sugar provides ≈4 kcal per gram, every additional 10 g adds ~40 kcal; regular excess intake contributes to weight gain if it tips energy balance beyond expenditure — small servings across meals add up quickly.
Term: Atwater factors: standardized coefficients assigning energy values to macronutrients (carbohydrates ≈4 kcal/g, protein ≈4 kcal/g, fat ≈9 kcal/g), used to calculate food energy content.
Calculation walkthrough (example): If a 16‑oz sweet tea in Texas contains 24 g added sugar, the sugar calories are 24 g × 4 kcal/g = 96 kcal from sugar alone. If daily maintenance is 2,000 kcal, those 96 kcal are ~4.8% of daily energy from that one drink.
Scenario comparison:
- Two sodas/day with 30 g sugar each → 60 g × 4 = 240 kcal/day → ~1,680 kcal/week from sugar (excess relative to no-sugar baseline).
- Replacing 2 tsp added sugar (8.4 g, ~34 kcal) with a zero-calorie sweetener saves ~34 kcal per instance; over a month this accumulates.
Weight implication: a sustained surplus of ~3,500 kcal is often equated to ~1 lb (0.45 kg) fat gain; consuming an extra 100 kcal/day from sugar could lead to ~10 lb annual increase if not compensated by activity or reduced intake elsewhere (source: energy balance modeling and dietary studies; see calorie deficit guidance calorie deficit diet ).
For targeted food choices that help offset excess sugar calories and assist central fat loss, review options in foods that aid belly fat burning.
Practical takeaways:
- Track grams of added sugar to quickly compute kcal from sugar using 4 kcal/g.
- Prioritize whole foods; sugars within fruit come with fiber, slowing absorption and offering micronutrients.
- Small changes (reducing one tablespoon of sugar daily) reduce weekly energy intake materially.
Transition: Next we examine how sugar calories influence blood glucose and diabetes risk, including clinical references and monitoring resources.
How do calories in sugar affect blood sugar and diabetes risk?
Answer: Calories from sugar raise blood glucose because digestible carbohydrate converts to glucose in the bloodstream; rapid ingestion of free sugars causes faster glucose spikes than complex carbs, which increases glycemic load and long-term diabetes risk when combined with excess energy intake and insulin resistance.
Term: glycemic index (GI): a relative ranking of carbohydrate foods by their effect on blood glucose; higher GI means faster glucose rise.
Physiology summary: simple sugars are quickly absorbed, elevating blood glucose; the pancreas releases insulin to clear glucose. Repeated large spikes and chronic caloric excess are associated with increased risk of type 2 diabetes (source: peer-reviewed cohort studies summarized below).
Clinical guidance and monitoring: for blood sugar targets and testing interpretation, consult the blood sugar level guide and the American Diabetes Association for clinical recommendations: American Diabetes Association.
Complementary supports: dietary control is essential, but some people explore adjunct natural options; review evidence-based complementary approaches at natural remedies for diabetes while following clinical care.
Evidence citation: According to a 2022 meta-analysis in a peer-reviewed journal, diets high in free sugars and sugar-sweetened beverages are associated with increased incidence of type 2 diabetes independent of weight in some analyses (source type: peer-reviewed study). The mechanism involves hepatic fructose metabolism, lipogenesis, and insulin sensitivity changes (see peer-reviewed sources linked).
Practical monitoring tip: calculate grams of carbohydrate per serving and use your glucometer after standard meals to observe individual glycemic response; individualized responses vary due to body size, insulin sensitivity, and activity (source: American Diabetes Association guidance).
Transition: For readers comparing sugar to substitutes and other carbs for calorie control and diabetic suitability, the next section summarizes calorie differences and practical choices.
How do sugar calories compare to other carbohydrates and sweeteners?
Answer: Digestible carbohydrates (including sugar) supply ~4 kcal/g; fats supply ~9 kcal/g and protein ~4 kcal/g. Artificial sweeteners have negligible or zero calories per serving, so calories differ dramatically even when sweetness is similar.
Below is a concise comparison chart of caloric density and practical impacts.
| Macronutrient / Sweetener | kcal per gram | Typical per-tsp kcal | Notes |
|---|---|---|---|
| Sugar (carbohydrate) | ~4 kcal/g | ~16–17 kcal | Provides quick energy; raises blood glucose |
| Protein | ~4 kcal/g | N/A | Satiating; slower glucose impact |
| Fat | ~9 kcal/g | N/A | Energy-dense; slower absorption |
| Aspartame (artificial sweetener) | Negligible per typical use | ~0 kcal (per serving) | Zero/low-calorie sweetener; see aspartame vs sugar for health details |
| Stevia / monk fruit (non-nutritive) | 0 kcal/g (used in tiny amounts) | 0 kcal | Suitable for reducing sugar calories |
Contextual links: for a deep dive on artificial sweeteners and health trade-offs, see aspartame vs sugar , and for low-calorie diabetic options consult best sugar substitutes for diabetics .
For broader carbohydrate caloric values refer to the carbohydrates guide at calories per gram for carbs.
Transition: With calorie comparisons in view, the final section provides practical, actionable tips to reduce sugar calories in daily life.
What practical tips can I use to manage sugar calories in my diet?
Answer: Reduce sugar calories by tracking grams of added sugar, substituting low- or no-calorie sweeteners when appropriate, measuring portions, choosing whole fruits over juices, and reading labels for added sugars per serving.
- Measure servings: use teaspoons and tablespoons to quantify sugar; 1 tsp ≈ 4.2 g → ~17 kcal.
- Swap strategically: replace one tablespoon sugar with a non-nutritive sweetener to save ~50 kcal.
- Choose whole fruit: fiber in fruit lowers glycemic impact and provides vitamins versus equivalent sugar in juice.
- Read labels: look for “added sugars” grams on Nutrition Facts to compute kcal (grams × 4 = kcal).
- Plan beverages: prefer unsweetened drinks or reduce sweetener incrementally to retrain palates.
- Use portion control: if baking, reduce sugar by 10–25%—many recipes tolerate reductions without sensory loss.
- Seek professional targets: for personalized daily sugar goals see daily sugar intake recommendations .
Additional tip for Texans: sweetened drinks and sweet tea are major local sources of added sugar; swapping to unsweetened iced tea or using single-serve controlled sweeteners can cut substantial calories from culturally common meals.
Transition: final summary and resources follow below.
Summary: What are the key takeaways about calories in sugar and how to apply them?
Answer: Sugar contributes ~4 kcal per gram, so tracking grams of added sugar gives a fast estimate of energy intake; reducing added sugar, substituting where appropriate, and choosing whole foods helps manage weight and blood glucose risk.
Key action points:
- Use 4 kcal/g as a quick calculator for sugar calories; verify with USDA entries for label-accurate planning — USDA Nutrient Database (source: government database, 2023).
- Monitor portion sizes in beverages and processed foods where added sugars concentrate.
- Consult clinical guidance for diabetes risk and blood sugar control — American Diabetes Association (source: clinical organization).
Final note on variability: caloric values can vary slightly by sugar form and processing (source: laboratory food composition reports, e.g., USDA 2023). Individual metabolic responses differ; use direct monitoring (weighing food, glucometer readings) for personalized management.
Call to action: Use the quick conversions in this guide to calculate sugar calories in your typical meals, then apply one small swap (e.g., reduce one tablespoon of added sugar daily) and monitor results over two weeks for measurable change.