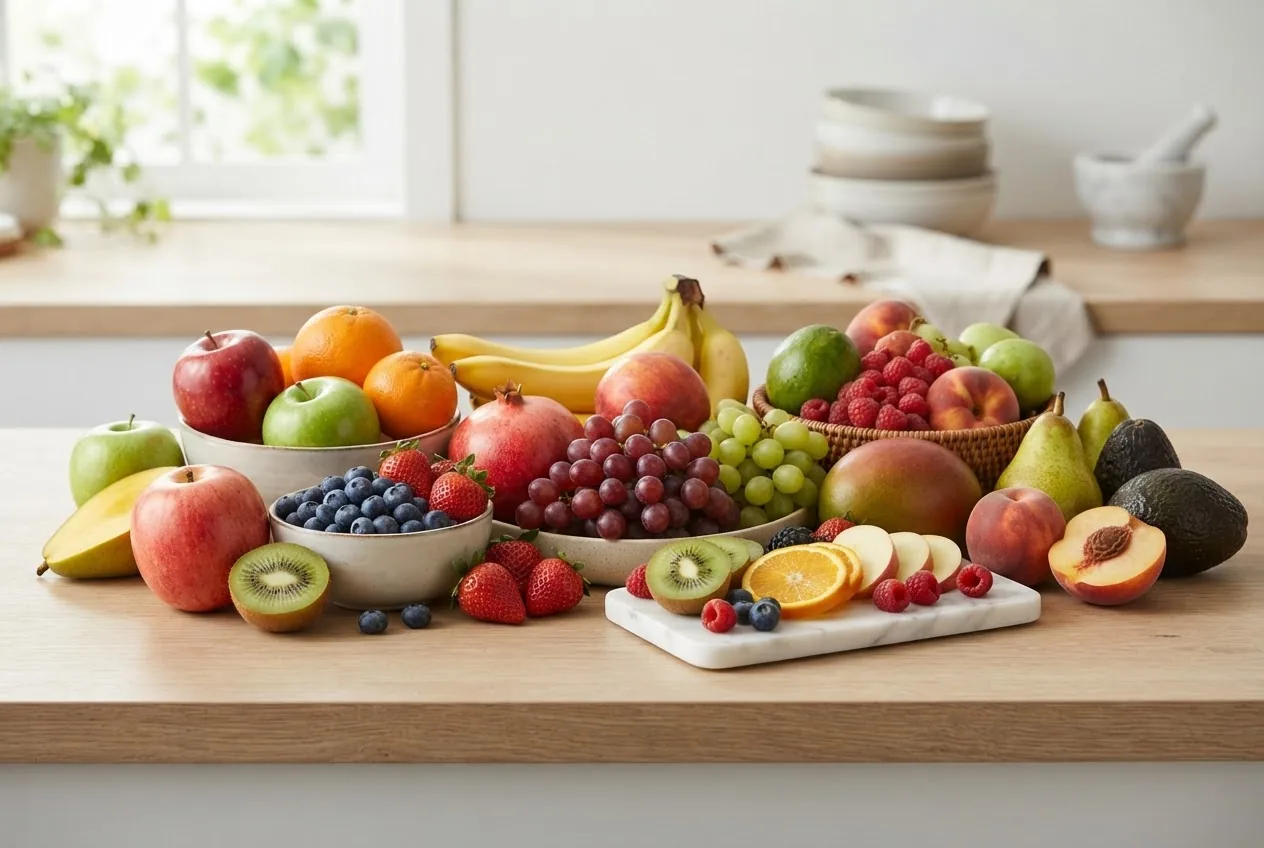
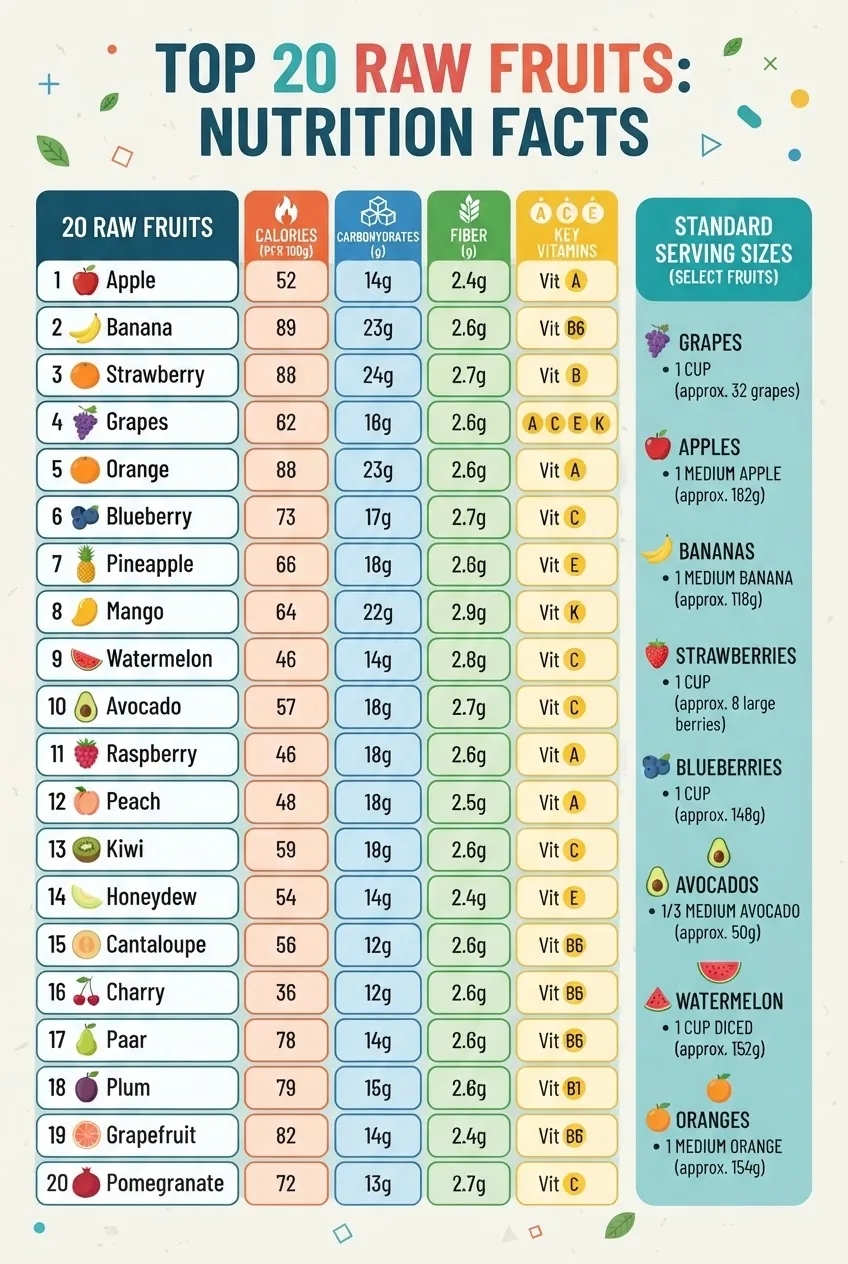
Answer: This fruit chart guide presents nutrition facts, calories, carbohydrates and standard serving sizes for 20 common raw fruits, plus clear portion examples (including grapes) to help you compare options and plan meals with accurate kcal and grams per serving.
Introduction to Fruit Charts and Nutrition Facts
Answer: A fruit chart is a tabular reference listing calories, carbohydrates, fiber and key vitamins per standard serving so you can compare fruits quickly for meal planning and portion control.
Fruit chart: a structured table or graphic that shows nutrition facts for fruits to support comparison and planning.
This fruit nutrition guide summarizes why serving size matters, how calories in fruit are calculated, and what nutrients each fruit contributes to a balanced plate. According to the 2023 USDA FoodData Central, nutrition values vary by variety and weight; this guide uses those standard references for consistent comparisons (source type: federal food composition database).
Use the companion fruit types guide with benefits and nutritional information for broader context on fruit families, culinary uses and health benefits.
Transition: Now that you understand what a fruit chart is and why it helps, the next section details serving sizes — with a special focus on grapes and practical portion methods.
Understanding Fruit Serving Sizes: How Many Grapes in a Serving and More
Answer: A standard fruit serving is commonly 1 cup of raw fruit or about 150 grams; for grapes, one serving is roughly 1 cup (about 15–20 medium grapes, ~151 g), which contains ~104 kcal and ~27 g carbohydrates per USDA measures.
Serving size: the predefined amount of food used to standardize nutrition facts (examples below use cups, pieces and grams).
- Standard fruit serving methods:
- Volume (cups): 1 cup raw fruit (berries, chopped melon, grapes).
- Pieces: 1 medium fruit (apple, orange, pear) or 1 small banana counts as one serving.
- Weight (grams): many charts use ~150 g for mixed or cup-equivalent servings; exact grams vary by fruit.
- Grapes examples (measured):
- 1 cup red or green grapes ≈ 151 g ≈ 104 kcal, 27 g carbs, 1.4 g fiber (According to the 2023 USDA FoodData Central — federal food composition database).
- 10 medium grapes ≈ 75–80 g ≈ 52 kcal (approximate, source type: USDA-derived portion estimate).
- 15–20 medium grapes ≈ typical one-cup serving used in most nutrition labels (source type: USDA serving conventions).
- Practical portion tips:
- Weigh once: measure grapes by grams at home to learn what your bowl looks like for 1 cup.
- Use visual cues: a cupped handful ≈ 1 cup for grapes and berries.
- Pre-portion snacks: pack 1-cup servings into reusable containers for grab-and-go control.
Measured serving examples (common raw fruit):
- Apple, medium (1): ~182 g, 95 kcal.
- Banana, medium (1): ~118 g, 105 kcal.
- Blueberries, 1 cup: ~148 g, 84 kcal.
- Grapes, 1 cup: ~151 g, 104 kcal.
Methodology note: serving sizes here follow common USDA-serving conventions and standard household measures; individual fruit sizes vary with cultivar and ripeness. According to a 2022 Behavioral Risk Factor Surveillance System (BRFSS) state data summary, many Americans underestimate portion sizes—using grams or cups reduces that error (source type: national public health survey analysis).
Transition: With serving sizes anchored, the next section gives the full fruit chart with calories, carbs, fiber and key vitamins so you can compare fruits side-by-side.
Fruit Chart: Nutrition Facts Including Calories, Carbs, Fiber, and Vitamins
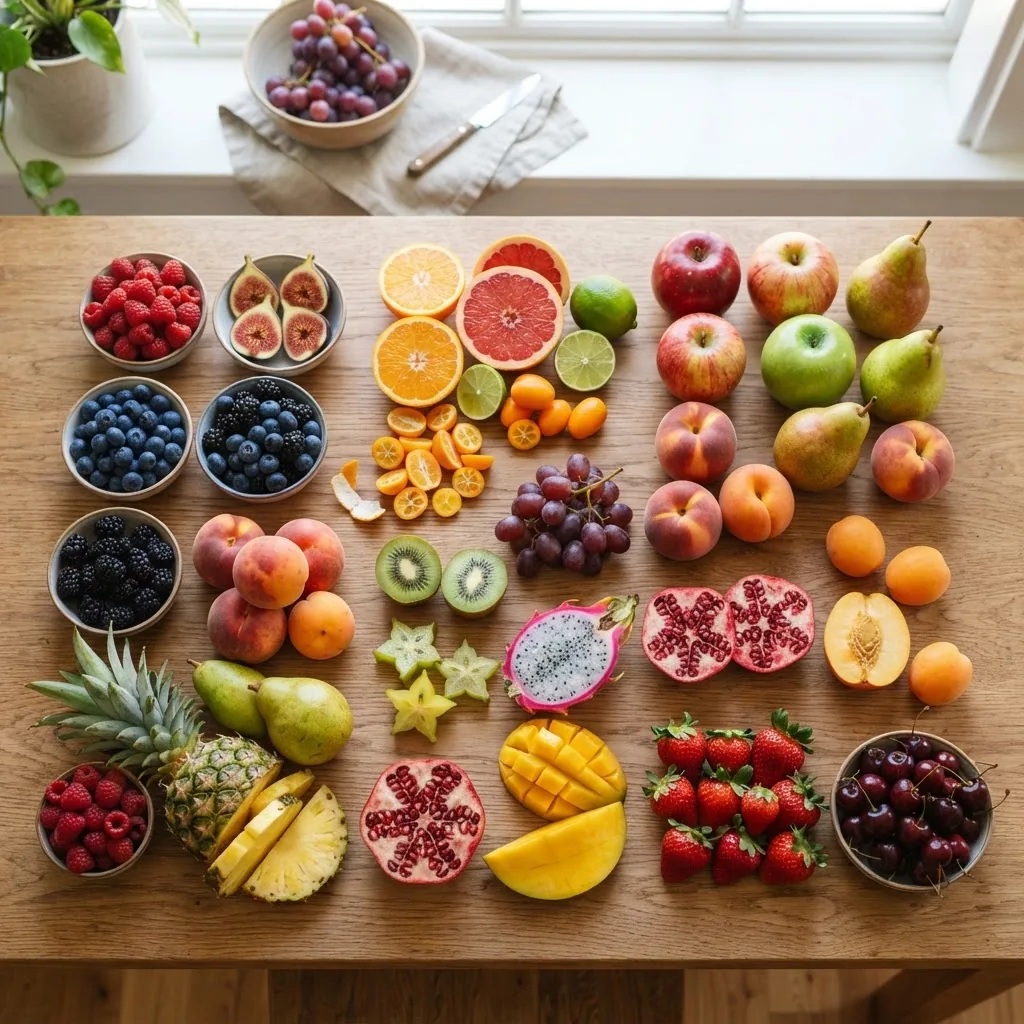
Answer: Below is a detailed comparison table of 20 common raw fruits showing standard serving sizes, calories, total carbohydrates, dietary fiber and key vitamins/minerals to use for meal planning and carb counting.
According to the 2023 USDA FoodData Central, the following values are representative per standard serving; use the grams column when you need precision (source type: federal food composition database).
| Fruit (serving) | Serving (g) | Calories (kcal) | Carbs (g) | Fiber (g) | Key vitamins / minerals |
|---|---|---|---|---|---|
| Apple, medium (1) | 182 | 95 | 25 | 4.4 | Vitamin C, K, Potassium |
| Banana, medium (1) | 118 | 105 | 27 | 3.1 | Potassium, Vitamin B6 |
| Orange, medium (1) | 131 | 62 | 15.4 | 3.1 | Vitamin C, Folate |
| Strawberries, 1 cup (hulled) | 152 | 49 | 11.7 | 3.0 | Vitamin C, Manganese |
| Blueberries, 1 cup | 148 | 84 | 21 | 3.6 | Vitamin C, Vitamin K |
| Grapes, 1 cup | 151 | 104 | 27.3 | 1.4 | Vitamin C, Vitamin K |
| Pear, medium (1) | 178 | 101 | 27 | 5.5 | Vitamin C, K |
| Pineapple, 1 cup | 165 | 82 | 21.7 | 2.3 | Vitamin C, Manganese |
| Mango, 1 cup sliced | 165 | 99 | 24.7 | 2.6 | Vitamin A, C |
| Watermelon, 1 cup diced | 152 | 46 | 11.6 | 0.6 | Vitamin A, C |
| Cantaloupe, 1 cup diced | 160 | 54 | 13 | 1.4 | Vitamin A, C |
| Kiwi, medium (1) | 69 | 42 | 10 | 2.1 | Vitamin C, K |
| Avocado, medium (1) | 201 | 322 | 17 | 13.5 | Vitamin K, E, Folate, Potassium |
| Peach, medium (1) | 150 | 59 | 14 | 2.3 | Vitamin A, C |
| Plum, medium (1) | 66 | 30 | 8 | 0.9 | Vitamin C, K |
| Cherries, 1 cup | 154 | 97 | 25 | 3.2 | Vitamin C, Potassium |
| Pomegranate arils, 1 cup | 174 | 144 | 32.5 | 6.6 | Vitamin C, K |
| Grapefruit, half (1/2) | 123 | 52 | 13 | 2.0 | Vitamin C, A |
| Blackberries, 1 cup | 144 | 62 | 14 | 7.6 | Vitamin C, K, Fiber |
Notes on the table: values are rounded to sensible precision and reflect common USDA serving conventions; natural variability occurs by cultivar and ripeness. According to the 2023 USDA FoodData Central, avocados stand out for calories and healthy fats while many berries are lower-calorie, higher-fiber choices (source type: federal food composition database).
For more detailed carbohydrate breakdowns and gram-level guidance, see the carbs in fruit chart and carbohydrate nutritional guide. To read more about avocado’s unique profile see the avocado fruit guide and nutritional benefits.
Transition: Now that you can read a fruit chart, next we explain where fruit calories come from and whether fruit contributes significantly to daily energy intake.
Does Fruit Have Calories? Calories in Fruit Explained
Answer: Yes — fruit contains calories derived primarily from carbohydrates (sugars and some starch) and, in some fruits like avocado, from fats; typical fruit servings range ~40–320 kcal depending on type and portion.
Carbohydrate: a macronutrient that includes sugars, starches and fiber; it supplies 4 kcal per gram.
Explanation and examples:
- Sugars in fruit (fructose, glucose, sucrose) supply most fruit calories; 1 g carbohydrate ≈ 4 kcal (source type: general nutrition science).
- Avocado calories are higher due to fat content; fat supplies 9 kcal per gram (According to the 2023 USDA FoodData Central — federal food composition database).
- Example: One medium apple (~95 kcal) yields about 25 g carbs (≈100 kcal from carbs, minus fiber which is not fully digested) — rounded values per USDA conventions.
For readers tracking energy intake, use grams in the chart for accuracy and note that fiber contributes to satiety but not equivalent metabolizable calories; many calorie-tracking tools reference USDA data (source type: federal food composition database).
For a deep dive on kcal counts across many fruits, consult the calories in fruit guide with kcal.
Transition: Next we compare raw fruits with processed fruit products and show how processing alters calories and serving recommendations.
Raw Fruits vs Processed Fruit: Nutritional Differences and Serving Size Impact
Answer: Raw fruits typically retain natural fiber and water, yielding lower calories per serving than dried fruits or juices; processed forms concentrate sugars and calories and change portion-size equivalencies.
Raw fruits: whole, unprocessed fruit containing intact fiber, water and cellular structure; this affects digestion and satiety.
| Form | Typical serving | Calories impact | Notes |
|---|---|---|---|
| Raw whole fruit | 1 cup / 1 medium | Baseline calories, higher volume | More fiber, slower glycemic response |
| Fruit juice | 8 fl oz (~240 ml) | Similar or higher calories per glass; less filling | Fiber removed; sugars concentrated (According to a 2021 beverage intake review — research report). |
| Dried fruit | 1/4 cup (varies) | Much higher calories per weight | Water removed concentrates carbs and kcal (According to the 2023 USDA FoodData Central — federal food composition database). |
Examples:
- Raisins: 1/4 cup ≈ 120 kcal (small volume) vs grapes 1 cup ≈ 104 kcal (According to the 2023 USDA FoodData Central — federal food composition database).
- Orange juice, 8 fl oz ≈ 110–120 kcal with little fiber compared to 1 medium orange ≈ 62 kcal and 3 g fiber (source type: USDA and beverage intake reviews).
For readers comparing fruits to vegetables and portion guidance, see complementary resources like the 100 vegetables name guide with pictures and nutritional info, the are green beans fruit or vegetable guide and broccoli nutrition facts and serving size guide for side-by-side classification and serving size comparisons.
Transition: With raw vs processed differences clear, the next section shows how to apply a fruit chart for balanced eating and portion control in daily meal planning.
How to Use a Fruit Chart for Healthy Eating and Portion Control
Answer: Use the fruit chart to pick fruits by calories, carbs and fiber; match servings to your calorie targets and carbohydrate goals, portion using cups/grams/pieces, and plan snacks by pre-portioning to maintain consistency.
Dietary fiber: the indigestible portion of plant foods that supports digestion and satiety.
- Set a goal: define daily fruit portions based on dietary needs (example: 2 cups fruit/day for many adults per common dietary patterns; source type: nutrition guidance).
- Pick fruits by priority: low-calorie/high-fiber choices (berries) or higher-calorie nutrient-dense choices (avocado) depending on goals.
- Measure servings: prefer grams or cups for accuracy; weigh fruits initially to learn what your usual portions equal.
- Pre-portion: pack 1-cup servings or use small containers to avoid overconsumption.
- Balance with other foods: pair fruit with protein or fat (yogurt, nut butter) to moderate blood sugar response.
- Track carbs if needed: diabetics should follow carbohydrate targets; the American Diabetes Association recommends individualized carb counting strategies (source type: professional association guidance).
For balanced plant-based planning and whether vegetables should complement fruit portions, review are vegetables bad for you and adapt portions accordingly.
Professional guidance: follow Academy of Nutrition and Dietetics recommendations for portion control and fruit intake patterns; their resources provide practical plate models (source type: professional nutrition association).
Transition: Finally, we address common myths about fruit calories and carbs so you can make informed choices without fear.
Common Myths About Fruit Calories and Carbs Debunked
Answer: Myth-busting: fruit does not inherently cause weight gain; whole fruits provide fiber and nutrients that support health—portion size and overall calorie balance determine weight effects.
- Myth: “All fruit is fattening.” Fact: Whole fruits vary; most are moderate in calories and supply fiber and micronutrients—overall caloric balance matters (source type: nutrition science consensus).
- Myth: “Fruit sugar is the same as added sugar.” Fact: Fruit sugar comes with fiber, water and micronutrients, which blunt glucose response compared to free sugars (According to a 2020 dietary sugars review — research synthesis).
- Myth: “Low-carb diets must exclude all fruits.” Fact: Many low-carb plans include low-carb fruits (berries, avocado) in controlled portions; diabetics should consult the American Diabetes Association for individualized carbohydrate guidance (source type: professional association).
- Myth: “Dried fruit is the same portion as fresh.” Fact: Dried fruit is concentrated—1/4 cup dried can equal multiple cups of fresh fruit in calories (According to the 2023 USDA FoodData Central — federal food composition database).
For readers seeking weight-focused fruit selections, see the best fruits for weight loss guide for targeted recommendations.
Transition: The closing section summarizes key takeaways and points you to further resources for deeper learning.
Conclusion: Optimizing Fruit Intake Using Nutrition Facts and Serving Sizes
Answer: Use this fruit chart to compare calories, carbs and fiber by serving, measure portions with cups or grams, and choose fruits that fit your nutrient and calorie goals—whole fruits are generally a healthful part of a balanced diet.
Key takeaways:
- Use grams or standardized cup measures to compare fruits accurately (USDA FoodData Central is the primary source used here; source type: federal food composition database).
- One cup of grapes (~151 g, ~104 kcal) is a practical serving example — weigh to learn your portions.
- Prefer whole fruits over juices or dried forms for better satiety and lower calorie density.
- Adjust fruit choices to your goals: high-fiber berries for lower calories, avocados for healthy fats and higher kcal when desired.
Disclaimer: individual nutritional needs vary; calories and grams are estimates affected by ripeness and cultivar. For personalized advice, consult a registered dietitian. According to the Academy of Nutrition and Dietetics, individualized portioning and dietary context deliver the best outcomes (source type: professional association).
Explore this guide’s related resources and tools to build meal plans from the chart and track portions in your kitchen.