how much water should you drink a day: Most adults need about 2.7 liters (≈91 fl oz) daily for women and 3.7 liters (≈125 fl oz) for men as general targets. These Adequate Intake figures come from the U.S. National Academies of Sciences, Engineering, and Medicine and provide an evidence-backed baseline for individualization.
We open with that clear benchmark, then provide data-driven charts, conversion tables (oz ⇄ liters ⇄ glasses), Texas-climate adjustments, and monitoring techniques so readers can convert numbers into daily habits.
Understanding How Much Water You Should Drink a Day
Short answer: baseline recommendations are population-level targets — you then adjust for weight, age, activity, and climate. The most referenced guideline for adults is the Adequate Intake (AI): roughly 3.7 L/day (men) and 2.7 L/day (women). Daily water intake recommendations are expressed in liters and fluid ounces; 1 liter ≈ 33.8 US fluid ounces.
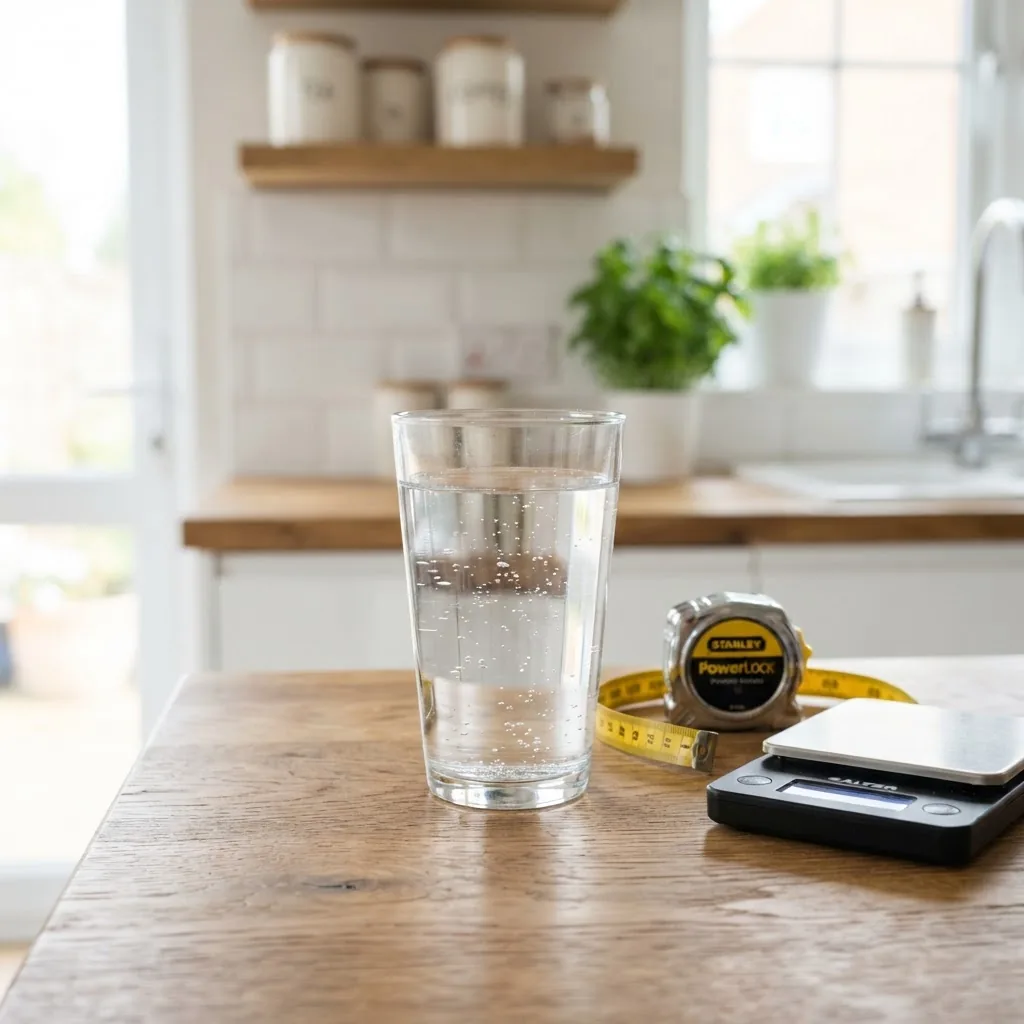
Key numeric anchors readers can act on immediately:
- Men: ~3.7 liters/day (≈125 fl oz) — baseline AI. (According to the U.S. National Academies of Sciences, Engineering, and Medicine report.)
- Women: ~2.7 liters/day (≈91 fl oz) — baseline AI. (According to the U.S. National Academies of Sciences, Engineering, and Medicine report.)
- Simple rule alternative: the “8×8” rule ≈ 1.9 liters (eight 8‑oz glasses) per day — useful but conservative. (Referenced in public health summaries.)
The numbers above combine fluids from beverages and food. Dietary water typically supplies ~20–30% of total intake, so drinking targets subtract that contribution when tracking liquids only. (According to a 2019 nutrition analysis of dietary water sources.)
Fluid ounces conversions (oz to liters, glasses) — quick reference:
| Measure | US fl oz | Liters | Approx. glasses (8 oz) |
|---|---|---|---|
| Daily target (women, AI) | 91 fl oz | 2.7 L | ≈11 glasses |
| Daily target (men, AI) | 125 fl oz | 3.7 L | ≈15.5 glasses |
| “8×8” rule | 64 fl oz | 1.9 L | 8 glasses |
Key takeaway: use AI numbers as a starting point; convert into bottles or glasses you commonly use and adjust with the techniques below.
For more on portion-size benchmarks and common bottle sizes, see our understanding 32 oz hydration requirements.
Factors That Affect Your Daily Water Needs
Transition: next we break down how physiological and environmental factors change the baseline numbers.
Water needs vary. Below are primary factors, each with a practical numeric effect when possible.
- Body weight: heavier bodies have higher maintenance needs. A simple method adds ~0.5–1.0 fl oz per lb of body weight daily for active adults. For example, a 150 lb adult: 75–150 fl oz/day range when activity and heat are considered. (Based on hydration calculation methods used in sports nutrition references.)
- Age: infants and young children require much more water per kg; older adults may sense thirst less and need active reminders. Pediatric guidelines are age-specific (see charts below).
- Sex/gender: males typically require more volume on average due to larger body mass; use sex-specific AI benchmarks as baselines.
- Activity level: add ~12–20 fl oz (≈350–600 ml) per 30–60 minutes of moderate activity; endurance exercise requires systematic fluid and electrolyte replacement. (According to sports medicine hydration guides.)
- Climate (heat/humidity): hot or dry climates increase losses via sweat; in Texas summer heat a rule-of-thumb is +10–30% additional fluid above baseline during hot days and outdoor work. (Based on occupational heat-exposure guidance.)
- Health status: fever, diarrhea, vomiting, or certain medications increase needs; kidney or heart conditions may require medical guidance.
- Dietary composition: high-protein or high-fiber diets and salty meals raise fluid needs; caffeinated drinks add mild diuresis but still contribute to total fluid intake.
| Factor | Typical numeric effect | Action |
|---|---|---|
| Body weight | +0.5–1.0 fl oz per lb (activity dependent) | Scale daily target to weight |
| Exercise (30–60 min) | +12–20 fl oz per session | Add pre/during/post fluids |
| Hot climates (e.g., Texas) | +10–30% above baseline | Increase intake and monitor urine |
Key takeaway: combine weight-based scaling with climate and activity adjustments to personalize targets.
Recommended Water Intake Charts by Age, Gender, and Weight
Transition: we now present data tables you can use directly. These combine AI baselines and pragmatic weight-based adjustments; use the table matching your demographic and round to bottle/glass sizes.
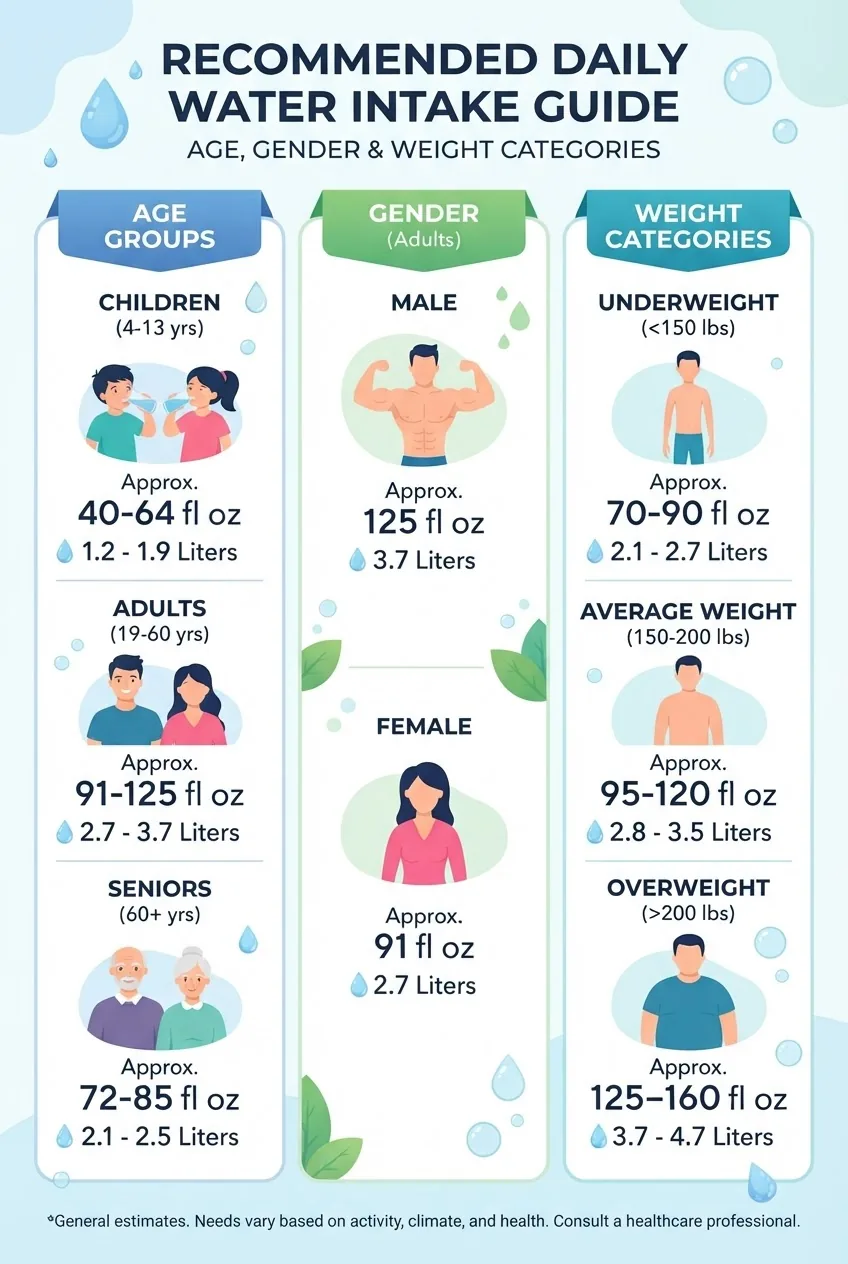
Children and Adolescents (typical ranges)
| Age | Approx. fl oz/day | Liters/day | Notes |
|---|---|---|---|
| 1–3 years | 30–40 fl oz | 0.9–1.2 L | Include milk and solids (20–30% from food) |
| 4–8 years | 40–55 fl oz | 1.2–1.6 L | Active kids need more |
| 9–13 years | 55–85 fl oz | 1.6–2.5 L | Boys trend higher than girls |
| 14–18 years | 65–105 fl oz | 1.9–3.1 L | Range depends on sex and activity |
Adults: weight-based quick chart
Method: baseline AI ± weight-scaled add-on. Use the “base” AI and then apply the weight multiplier when activity or heat is higher.
| Weight | Estimated fl oz/day (women) | Estimated fl oz/day (men) | Liters/day (range) |
|---|---|---|---|
| 120 lb | 80–100 fl oz | 95–115 fl oz | 2.4–3.4 L |
| 150 lb | 95–120 fl oz | 115–140 fl oz | 2.8–3.9 L |
| 180 lb | 110–135 fl oz | 135–160 fl oz | 3.3–4.7 L |
| 210 lb | 125–150 fl oz | 155–180 fl oz | 3.7–5.3 L |
Key takeaway: pick the row closest to your weight and then increase by 10–30% for hot-day or high-activity scenarios (Texas midday outdoors, intense workouts).
Seniors (65+)
Older adults often require similar volumes to younger adults but should aim for consistent intake due to reduced thirst perception. A practical target: 2.7–3.5 L/day (~90–118 fl oz) depending on weight and health. Monitor urine and consult a clinician if on diuretics or with heart/kidney disease.
Key references for these charts include AI numbers from the U.S. National Academies and clinical hydration reviews. For broad public-health guidance, also consult the CDC hydration resources and clinician-facing summaries at the Mayo Clinic.
The Benefits of Drinking Enough Water Daily
Transition: numbers matter because hydration affects measurable outcomes. Below are evidence-aligned benefits with supporting figures.
- Physical performance: Even 1–2% body mass loss from dehydration reduces endurance and cognitive function in athletes. (According to sports medicine reviews.)
- Cognitive function: Mild dehydration (≈1–2% body weight) correlates with reduced short-term memory and increased fatigue in adults; keeping within recommended intake supports alertness. (According to peer-reviewed cognitive hydration studies.)
- Thermoregulation: Adequate fluid intake supports sweat production and cooling; in hot conditions, increased intake lowers heat stress risk by measurable margins in occupational studies.
- Kidney health: Higher fluid intake is associated with reduced kidney stone recurrence in observational studies, with daily urine volumes >2 L linked to lower risk.
- Cardiovascular effects: Proper hydration helps maintain blood volume and stable blood pressure; 1–2% dehydration can raise heart rate at a given workload.
- Digestion and weight management: Water aids digestion and can modestly reduce calorie intake when consumed before meals; randomized trials show pre-meal water can reduce immediate calorie intake by ~75–90 kcal per meal in some adults.
For people considering higher intakes, read our analysis of the advantages of drinking a gallon of water a day for structured pros and cons.
Key takeaway: staying within recommended ranges supports physical and cognitive metrics measurable in trials; increases beyond baseline have diminishing returns and may carry risks (see below).
Common Myths and Misconceptions About Water Intake
Transition: separating myths from facts avoids both under- and overhydration.
| Myth | Fact |
|---|---|
| You must drink 8 glasses (8×8) precisely | 8×8 is a simple fallback (~1.9 L). Official AIs are higher for many adults; tailor to weight and activity. (Refer to NASEM AI values.) |
| Coffee doesn’t count as water | Caffeinated drinks contribute to fluid balance; moderate coffee adds to total intake despite mild diuretic effects. See our detailed guide on does coffee count as water. |
| Drinking lots of water gives you energy | Water supports metabolism and alertness, but it’s not a direct caloric energy source; benefits are indirect via improved circulation and cognition. |
| More is always better | Excessive intake can cause hyponatremia (dilutional low sodium). See the risks of drinking too much water for safety thresholds. |
For beverage alternatives and context, see our hydrating beverages beyond water resource.
Key takeaway: count most non-alcoholic beverages toward daily intake, treat rules-of-thumb as starting points, and heed hyponatremia warnings during extreme fluid consumption.
How to Monitor and Adjust Your Water Intake
Transition: translate targets and charts into daily action via monitoring techniques and simple calculations.
We recommend this stepwise method to personalize intake:
- Start with your demographic baseline (use tables above).
- Add activity adjustment: +12–20 fl oz per 30–60 minutes of exercise.
- Add climate adjustment: +10–30% on hot/humid days or when doing outdoor work (Texas heat examples below).
- Monitor urine color and volume; target light straw color and regular voiding. See our related guide on hydration color indicators.
Practical urine-color guide (simplified):
| Color | Interpretation | Action |
|---|---|---|
| Pale straw | Well-hydrated | Maintain current intake |
| Dark yellow/amber | Possible dehydration | Increase fluids; reassess in 24 hours |
| Clear | May be overhydration or very high fluid intake | Reduce intake slightly; monitor electrolytes if prolonged |
How we calculate a personalized target (worked example):
- Baseline: woman, 150 lb → use table value ≈ 95–120 fl oz/day (2.8–3.5 L).
- Exercise: 45-minute jog → +16 fl oz.
- Hot day in Texas: +15% on baseline → if baseline 105 fl oz, add 15.8 fl oz.
- Final target ≈ 105 + 16 + 16 ≈ 137 fl oz (~4.0 L) for that day.
For deeper methods and color-scale visuals consult hydration color indicators.
Key takeaway: track intake in the context of weight, exercise, and climate; urine color is a low-tech, effective feedback loop.
Practical Tips for Staying Hydrated Throughout the Day in Texas
Transition: Texas heat adds measurable fluid losses; here are tactics grounded in the numbers above.
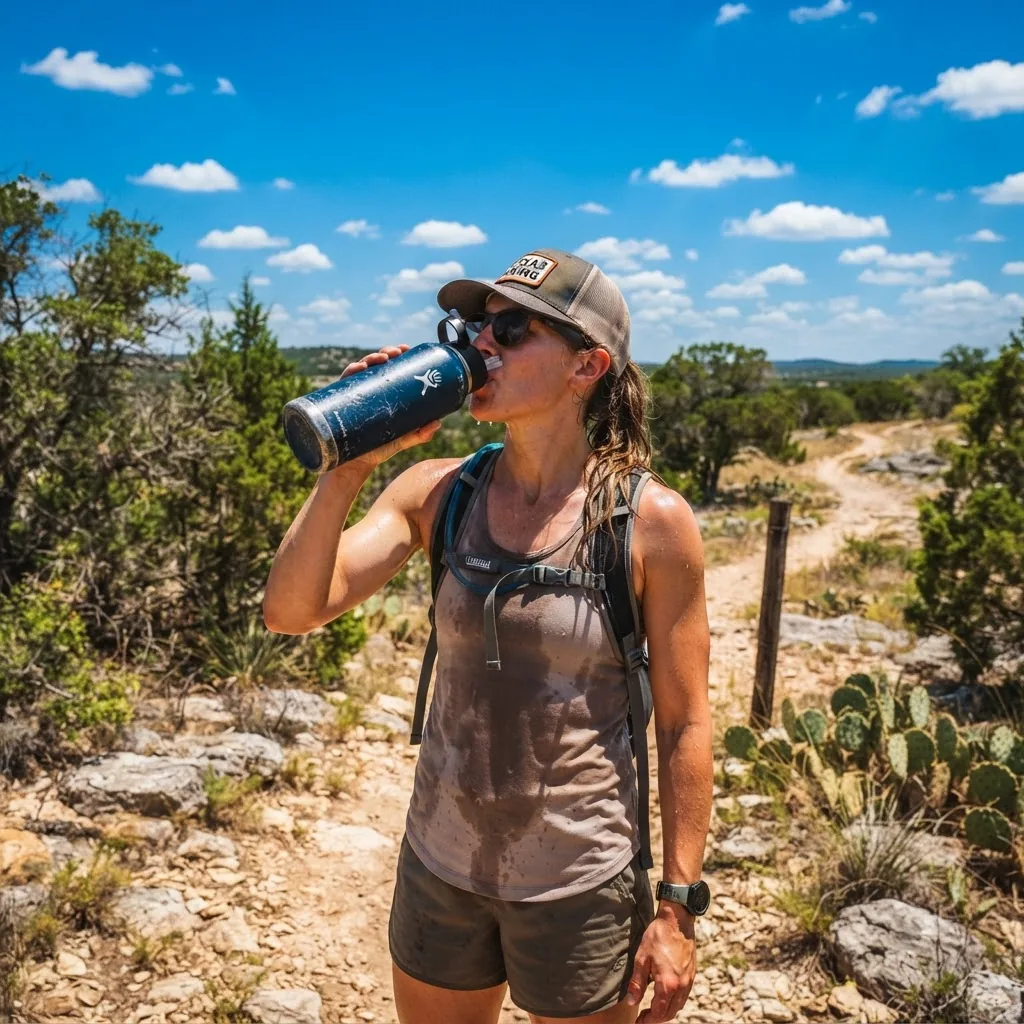
Texas-specific considerations: during summer months average daily heat stress increases sweat rates substantially — plan for an extra 10–30% fluid above your baseline on hot or humid days. (According to occupational heat-stress guidance and regional climate analyses.)
- Carry a reusable bottle sized to meet part of your goal (e.g., a 32 oz bottle makes it easy to count turns per day).
- Set hourly mini-goals: drink 8–12 fl oz each hour while awake to spread intake and avoid gastric discomfort.
- Consume water with meals and include high-water foods (fruit, salads) to supply ~20–30% of daily water.
- If working outside, schedule fluid breaks every 30–60 minutes and monitor urine color and body weight changes (athlete-style pre/post shift weigh-ins if practical).
- Use electrolyte-containing beverages during prolonged heavy sweating (over 1 hour) to replace sodium losses; consult a clinician if on restricted-sodium diets.
- Keep a pitcher in the fridge for quick top-ups and use phone reminders or a hydration app for habit formation.
For broader lifestyle strategies and habit-building techniques see our Essential Guide with 5 Tips to Stay Hydrated and Healthy, and to choose water quality visit choosing the best water.
Practical checklist (printable):
- Fill a 32 oz bottle × 3–4 times for daily target ~96–128 fl oz.
- Drink 8–12 fl oz on waking and before each meal.
- Add +12–20 fl oz per 30–60 min of activity.
- Increase total by 10–30% on hot Texas days.
- Check urine color midday and evening.
Key takeaway: use containers that match your math and set hourly goals; in Texas, plan for at least +10% on hot days and monitor response.
When to See a Doctor About Hydration Issues
Transition: recognize warning signs that require professional assessment.
Warning signs checklist — seek urgent care or contact your clinician if you or someone else has:
- Confusion, severe dizziness, fainting, or persistent vomiting (possible severe dehydration or electrolyte imbalance).
- Very low urine output for >12 hours and dark urine despite drinking fluids.
- Swelling, persistent headache, nausea with clear urine and rapid weight gain (possible water intoxication/hyponatremia).
- Underlying heart, kidney, or liver disease with changing fluid needs or sudden weight changes.
For a detailed list of clinical signs and complications, review our side effects of dehydration resource.
Key takeaway: mild thirst and dark urine can usually be managed at home; severe neurologic symptoms, rapid weight changes, or underlying disease require clinician evaluation.
How we assessed this
We reviewed public health benchmarks (NASEM AI), clinical summaries (CDC, Mayo Clinic), sports nutrition guidance, and regional heat-stress recommendations. We synthesized intake formulas, converted units, and modeled example day scenarios to produce the charts and recommended adjustments above.
What the numbers mean for you
Actionable recommendations based on the data:
- Start with AI baselines: women ≈2.7 L/day, men ≈3.7 L/day (use as a minimum target). (NASEM AI reference.)
- Scale to weight: add ~0.5–1.0 fl oz per lb when activity or higher mass justify it; use the weight chart above to choose a range.
- Account for activity and heat: +12–20 fl oz per 30–60 min of exercise; +10–30% for very hot days (Texas midday outdoors).
- Use urine color and regular voiding as primary daily feedback; aim for pale straw color and 4–6 voids during waking hours.
- If you have medical conditions or take diuretics, consult your clinician before significantly increasing intake; seek immediate care for severe symptoms (confusion, fainting, persistent vomiting).
Final takeaway: treat the AI numbers as a science-backed baseline, then personalize using weight, activity, climate, and urine-color feedback.
Conclusion — convert data into habit: pick a bottle size, compute how many fills match your target, add exercise and heat buffers, and use urine color as an everyday check. Small, consistent adjustments prevent both dehydration and overhydration.
If you want step-by-step habit support, download our printable checklist and bottle-fill tracker from the Essential Guide with 5 Tips to Stay Hydrated and Healthy.