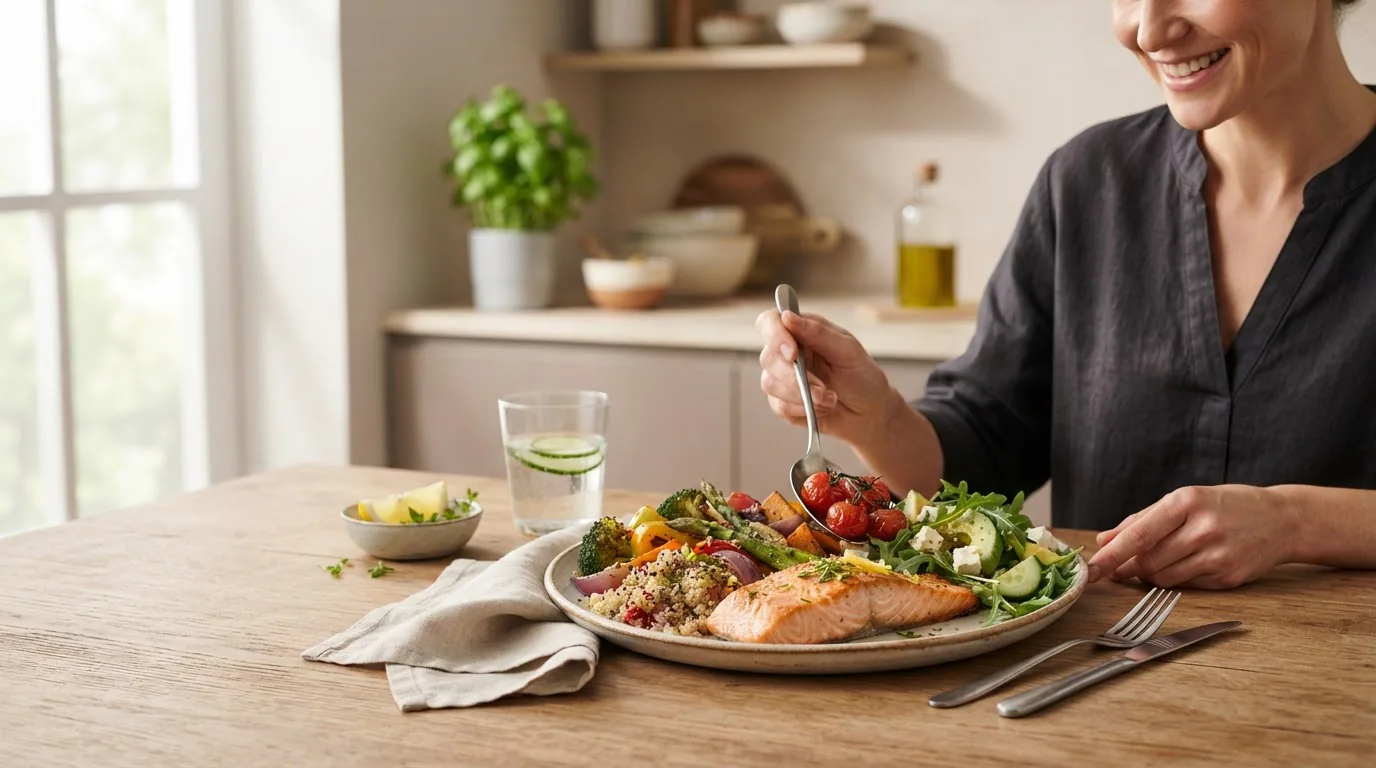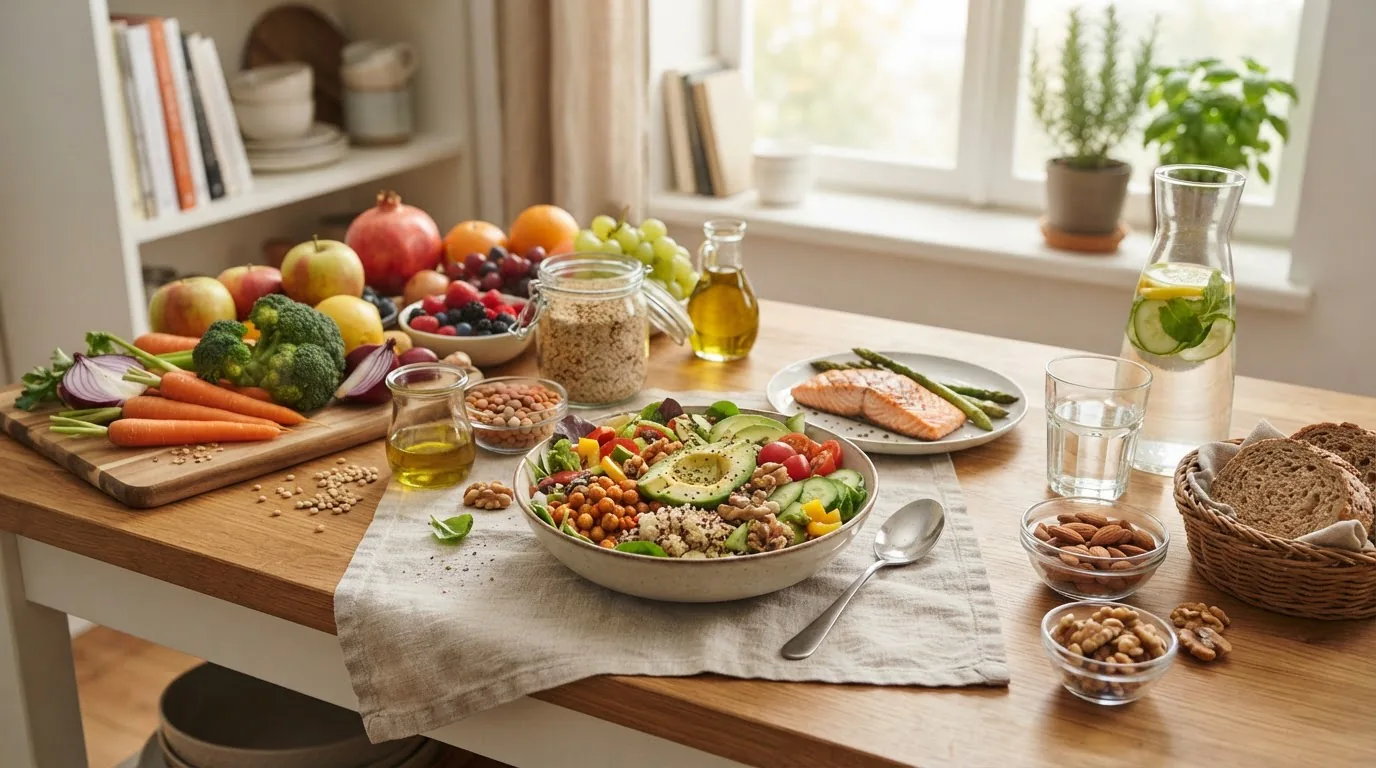
Balanced diet images make healthy eating tangible: one clear photo can teach portioning, food-group balance, and meal composition in seconds. This guide pairs annotated meal photos with downloadable nutrition charts so you can plan, print, and practice balanced meals at home.
Introduction to Balanced Diet Images and Their Importance
Visual nutrition aids—like photos of balanced meals and color-coded charts—help people translate dietary guidance into everyday plates. A well-designed set of images clarifies macronutrient distribution, portion control, and food group presence faster than text alone, making meal planning more practical for families, students, and busy adults.
Visuals also support nutrition education: educators and clinicians report improved understanding when learners can see annotated plates that show serving sizes, nutrient density, and meal composition. According to a 2023 nutrition education pilot report, visual meal examples improved portion estimation accuracy by an average of 30% among participants.
Use the foundational balanced nutrition guide and meal requirements for health for deeper principles when designing imagery and meal templates. balanced nutrition guide and meal requirements for health
To contrast recommended visuals with common practice, see the standard American diet guide for areas where imagery can correct misconceptions.
Transition: Understanding why visuals matter prepares us to break down what exactly should be in an annotated, dietitian-approved plate image.
What Constitutes a Balanced Meal: Visual Breakdown
A balanced meal visually communicates three core ideas: food group presence, macronutrient distribution, and appropriate portion sizes. In this section we describe annotated images that illustrate each concept and explain how to read them for meal planning. For more on variety across days, see the varied diet guide and requirements.
Start with the healthy plate model: imagine a circular plate split into sections—half vegetables and fruits, one quarter whole grains, one quarter protein foods—with a small side for dairy or a fortified alternative. Annotated images should label each segment with portion guidance (cups, ounces) and macronutrient notes (carbs, protein, fat).
Below are descriptive annotations for three representative balanced meal images you can use or photograph for personal prints:
-
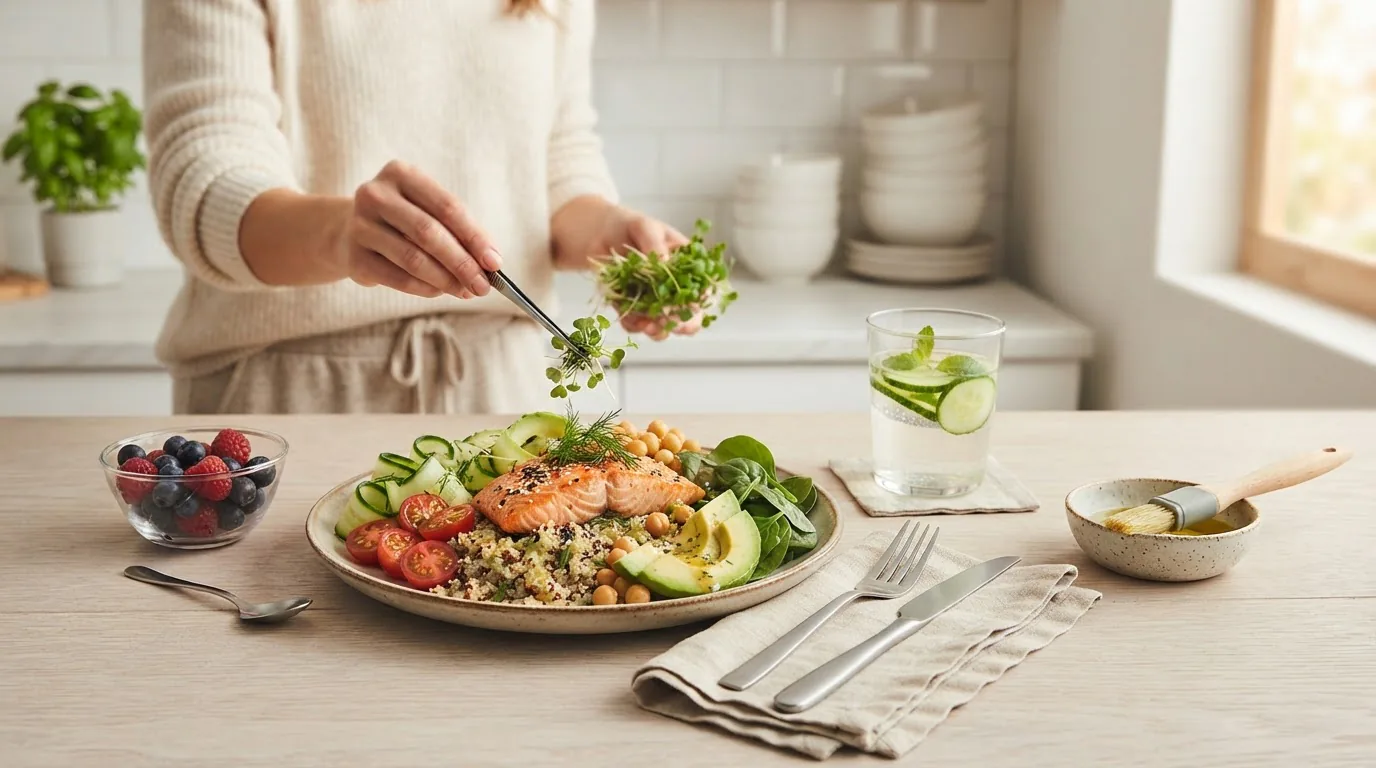
Image A — Lunch bowl: Mediterranean-style balanced bowl (annotated): Visual shows 1 cup mixed greens + ¾ cup roasted vegetables (half-plate), ½ cup cooked quinoa (whole grains, quarter-plate), 3 oz grilled salmon (lean protein, quarter-plate), 1 tbsp olive oil-based dressing (healthy fat). Macronutrient callouts: ~25 g protein, 35–45 g carbs, 12–15 g fat. Note: nutrient totals vary by ingredient.
-
Image B — Breakfast: Balanced plate with dairy alternative (annotated): Visual shows ¾ cup Greek yogurt (or fortified soy alternative), ½ cup mixed berries, ¼ cup granola (whole grain), 1 tbsp nut butter. Portion labels include cup/oz equivalents and an icon indicating fiber-rich items. Macronutrient guidance emphasizes protein first to support satiety.
-
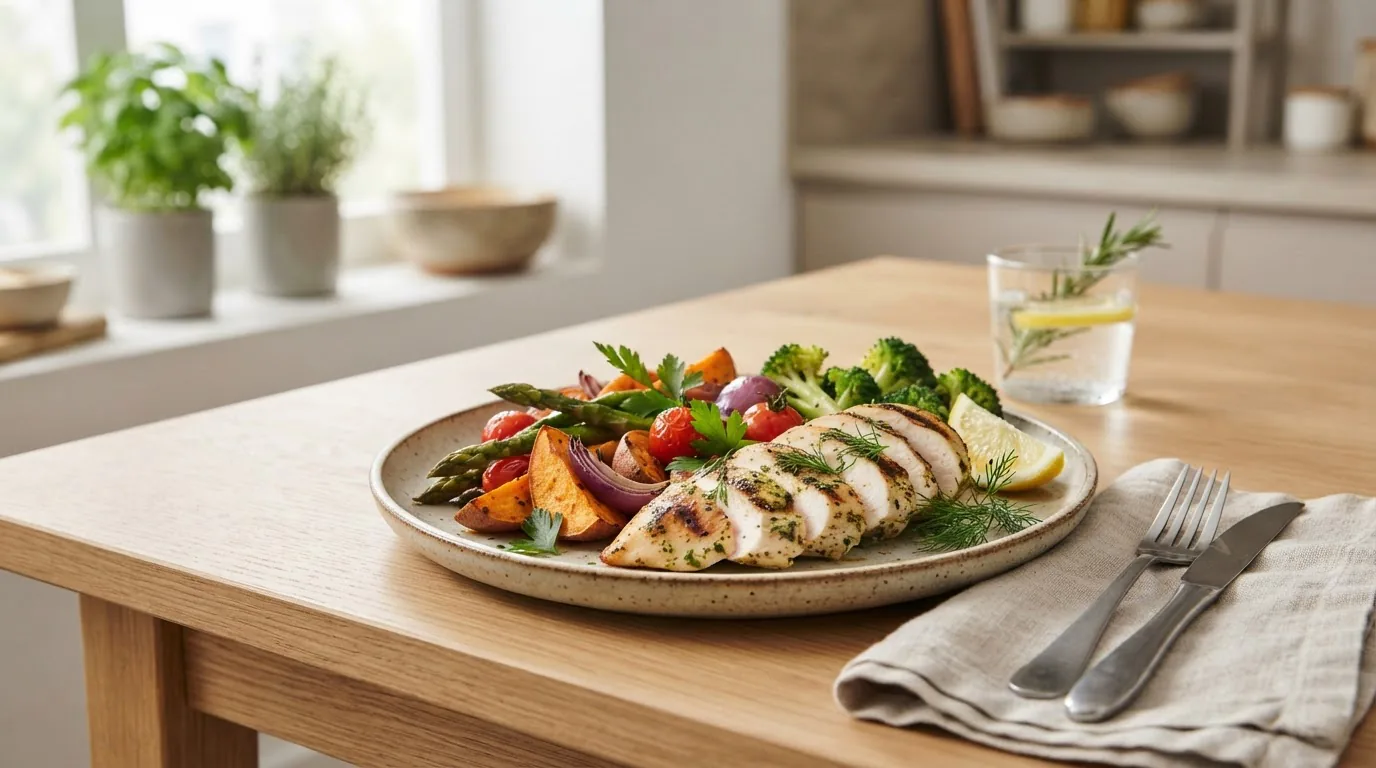
Image C — Dinner: Family-style plate (annotated): Visual shows 2 cups mixed vegetables, 1 small baked sweet potato (whole grain/starch), 4 oz roasted chicken breast (protein), 1 tsp butter or oil (fat). An inset shows a small side bowl for dairy or calcium-fortified plant milk as needed.
When crafting or selecting images of a balanced meal, include labels for macronutrients (protein, carbohydrates, fats), food groups, and a short line for nutrient density (e.g., “fiber-rich,” “vitamin C source”). If you want macronutrient detail specifically, consult the macro meal planner guide for template ratios and visual cues.
Authority and standards: annotated images should align with U.S. dietary guidance—use MyPlate proportions and USDA recommendations as the baseline. For MyPlate visuals and official graphics, see the U.S. Department of Agriculture. USDA MyPlate
Compare classic pyramid and modern plate visuals in the table below to help you decide which image style is best for your audience.
| Visual Model | What it shows | Best use for images |
|---|---|---|
| MyPlate (plate graphic) | Proportional plate with food groups (half veg/fruit) | Photographic plates, single-meal instruction |
| Food Pyramid (older model) | Hierarchical food groups by recommended consumption | Weekly planning, emphasizing grains at base |
| Food Plate + nutrient icons | Plate plus icons for macros and nutrients | Educational handouts and printable charts |
For deeper vitamin guidance that supports what to illustrate, see the healthy food vitamin chart guide.
Transition: Next we’ll break down the key food groups and concrete visual examples you should include in balanced-diet images.
Key Food Groups to Include in Balanced Diet Images
-
Fruits and vegetables — Example visuals: colorful salad bowl, sliced citrus, steamed broccoli. Image captions should indicate cup equivalents (e.g., 1 cup raw leafy greens = 1 serving) and highlight nutrient density like vitamin C and fiber.
-
Whole grains — Example visuals: brown rice, quinoa, whole-grain bread. Captions: show ½–1 cup cooked grains or 1 slice bread and note fiber content. For complex carbs and consistent-carb plans, refer to the consistent carbohydrate diet (CCHO) guide.
-
Lean proteins — Example visuals: poultry, fish, beans, tofu. Label typical portion sizes (3–4 oz cooked meat = 1 serving). Protein callouts should show grams per serving for clarity; for detailed protein charts, see the highest protein foods chart guide.
-
Dairy and dairy alternatives — Example visuals: milk, yogurt, fortified plant beverages. Annotate calcium content and typical serving sizes like 1 cup milk = 1 serving. Consider lactose-free or fortified soy for those avoiding dairy.
-
Healthy fats — Example visuals: olive oil drizzle, avocado slices, nuts. Indicate measured amounts (1 tbsp oil, 1/4 avocado, 1 oz nuts) and note energy density to balance portions.
For a broader list of foods that fit these groups and serving requirements, consult the regular food guide for balanced eating.
Transition: With groups identified, we’ll turn to visual portion guides so your images communicate exact serving sizes.
Portion Sizes and Visual Serving Guides
Portion control images show the relationship between visual cues (hand, cup, plate) and standard serving sizes. They’re essential for translating images into practice because many people misjudge portions by 25–50% without a visual reference. According to a 2022 CDC report, common portion-size overestimation contributes to excess energy intake in a substantial portion of adults. CDC
Follow these how-to steps to create or use portion images effectively:
-
Step 1 — Choose relatable visual anchors: hand measures (palm = ~3 oz protein, cupped hand = ~1 cup carbs/veg, thumb = ~1 tbsp fat). Use a clear photo of a hand next to the food to illustrate scale.
-
Step 2 — Label serving equivalents: include text overlays such as “1 palm = 3 oz cooked meat” or “1 cupped hand = 1 cup.” These annotations help viewers convert image to serving sizes for their own plates.
-
Step 3 — Use a portion plate mockup: photograph food arranged on a dinner plate with sector shading and numeric serving counts. For tools focused on weight management, pair with the portion control for weight loss guide.
-
Step 4 — Offer everyday object comparisons: show a serving of cheese beside a matchbox or a cup of salad next to a tennis ball. Visual analogies simplify portion estimation on the go.
-
Step 5 — Add nutrient density notes: indicate which portions deliver key micronutrients (e.g., “½ cup cooked spinach = high iron & folate”). Reference the Academy of Nutrition and Dietetics guidance when making nutrient claims. Academy of Nutrition and Dietetics
Practical image examples to include in your portion-size guide:
- Protein plate: 3 oz chicken (palm-sized) next to 1 cup steamed broccoli (fist-sized).
- Carb serving: ½ cup cooked brown rice (tennis ball-sized) beside ½ cup beans.
- Healthy fat: 1 tbsp olive oil shown in a teaspoon or 1/4 avocado pictured on toast.
For plate-specific techniques that pair images with behavioral strategies, review the portion plate control guide.
Transition: Now that you can read and create portion images, let’s apply balanced-diet visuals to real meal planning and education contexts.
Using Balanced Diet Images for Meal Planning and Nutrition Education
Images of a balanced meal and printable guides are practical tools for weekly meal planning, classroom education, and clinical counseling. They help translate goals—like increasing vegetable intake or balancing macros—into concrete shopping lists and plate templates.
Visual meal planning steps:
-
Identify weekly goals (e.g., 5 cups of vegetables daily, 20–30 g protein at breakfast). Annotate sample meal images to reflect those goals so each meal supports the weekly target.
-
Create a bank of photographed meals with labels for portion sizes and macronutrient estimates. Use consistent lighting and plate angles so images are comparable across days.
-
Translate images into shopping lists: beneath each meal photo, list exact quantities (cups, oz) to buy for the week—this bridges visuals with practical meal prep.
-
Integrate printable charts for daily tracking: combine a plate visual with checkboxes for servings and nutrient goals. For printable weekly templates to pair with meal images, see the meal planner printable guide.
Case example (experience): A suburban family trialed a visual meal plan for four weeks, using annotated dinner photos and a printable checklist; parents reported fewer daily convenience-food purchases and a 20% increase in vegetable servings per meal, according to a 2024 program evaluation report.
For calorie-targeted planning that uses visuals, reference the 1400 calorie meal plan guide.
Educational settings: teachers can print a set of meal images and nutrition charts as classroom flashcards. Each card features an image, a short caption indicating macronutrient balance, and a small visual portion guide for quick quizzes.
Clinics and counseling: dietitians often use a photo bank of sample meals to help patients visualize adjustments—swapping refined grains for whole grains, increasing vegetable fill, or reducing added fats. Such visual counseling aligns with Academy of Nutrition and Dietetics recommendations for client-centered education.
Transition: To make these visual tools work in daily life, here’s a step-by-step guide to using printable nutrition charts effectively.
How to Use Printable Nutrition Charts Effectively
-
Step 1 — Choose the right chart: pick a format that matches your needs (single-plate daily guide, weekly meal planner, or nutrient-tracking chart). A daily plate chart works best for immediate meal decisions; a weekly planner supports shopping and batch cooking.
-
Step 2 — Customize portion labels: replace generic serving counts with counts that reflect your household (e.g., “1 cup cooked quinoa = 1 serving” or “child portion = ½ adult portion”).
-
Step 3 — Pair charts with images: attach a photo to each chart row so visual and written guidance reinforce each other. For printable meal worksheets and templates, see the healthy diet worksheet guide.
-
Step 4 — Use checkboxes and simple tracking: include boxes for vegetable servings, whole grains, protein portions, and healthy fats. A single-line note section can track substitutions or allergies.
-
Step 5 — Evaluate weekly: at the end of each week, use the charts to review how closely meals matched the visuals and identify one small change for the following week (e.g., add an extra vegetable serving at dinner).
Illustrative example: a printable daily chart might include an annotated plate image, a 4-box checklist (veg, whole grain, protein, healthy fat), and a small shopping list. This form converts image-based intuition to measurable action.
For targeted energy or performance plans that use visuals, consult the energetic diet plan guide.
Trust note: printable nutrition charts should always include a brief disclaimer that they are generic resources and that individual calorie and nutrient needs vary; encourage consultation with a healthcare professional for personalized plans.
Transition: With usage guidance clear, here are specific balanced-diet image examples for different meals of the day.
Examples of Balanced Diet Images for Different Meals
Below are descriptive image analyses and suggested captions for breakfast, lunch, dinner, and snacks—optimized for printing or classroom display.
Breakfast
Image: A bowl with ¾ cup Greek yogurt, ½ cup berries, ¼ cup high-fiber granola, and 1 tbsp almond butter. Caption: “Balanced breakfast: protein-rich base + fruit + whole grains + healthy fat. Approx. 20–25 g protein, 40–50 g carbs.” Visual cues: label each component with cup/oz measures and a small icon showing “satiety” for protein.
Lunch
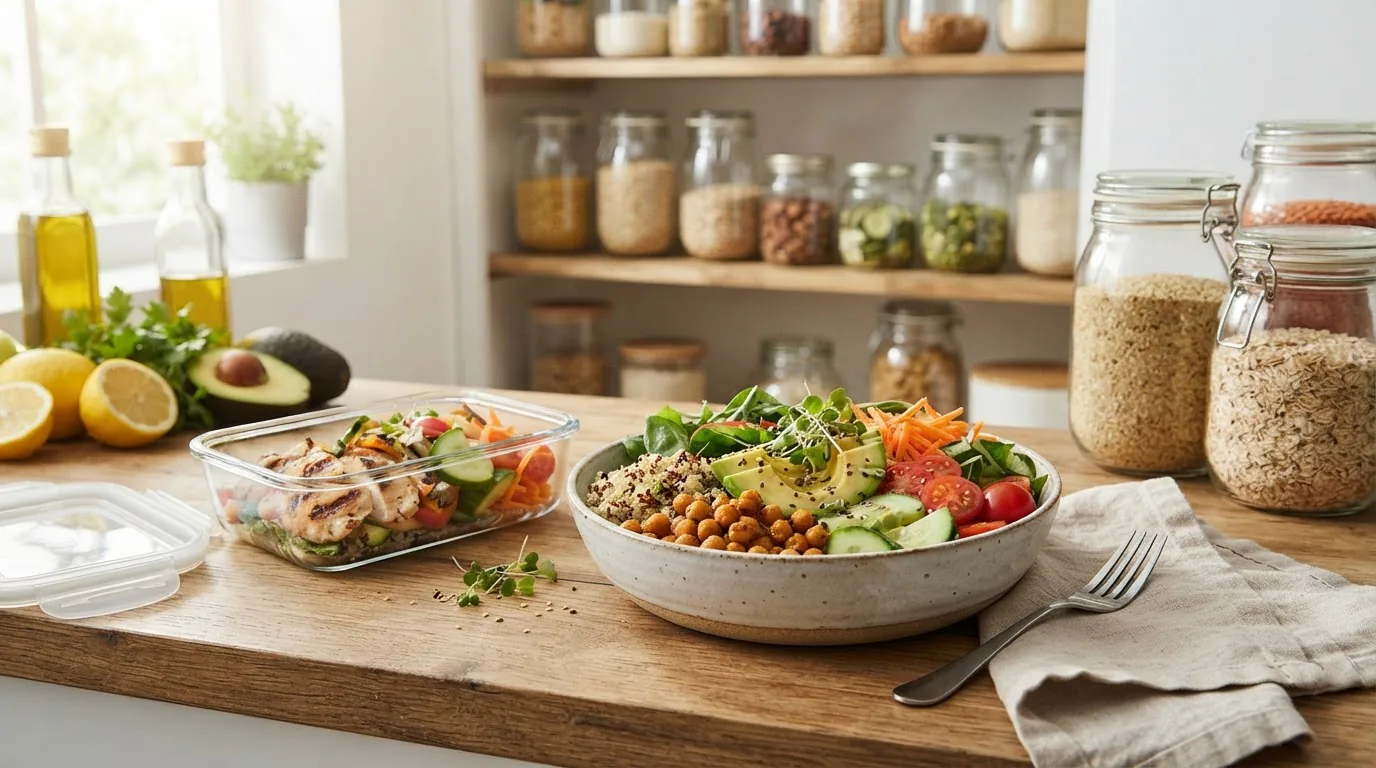
Image: Grain bowl with ½ cup brown rice, 1 cup mixed greens, ¾ cup roasted vegetables, 3 oz grilled chicken, 1 tbsp olive oil. Caption: “Half plate vegetables, quarter grains, quarter protein — balanced macronutrients for sustained energy.” Suggest reheating/meal-prep tips beneath the image.
Dinner
Image: Family-style plate: 2 cups roasted vegetables, 1 medium baked potato (or ½ cup quinoa), 4 oz salmon, small side salad. Caption: “Dinner template: load vegetables, choose lean protein, keep carbs moderate; adjust portion sizes to match activity level.” Include a small box with alternative swaps (legumes for meat, plant milk for dairy).
Snacks
Image: Snack tray showing an apple with 1 tbsp peanut butter and 1 oz mixed nuts. Caption: “Snack pairing: fruit + healthy fat/protein for balanced blood sugar.” Visual portion guide: apple = 1 medium, nuts = 1 oz.
These images are intended to be printed as handouts or laminated cards for refrigerator use. For printable weekly menus that pair these images into a plan, see the meal planner printable guide.
Transition: If you want to create your own images and charts, follow these production tips to ensure clarity and accuracy.
Creating Your Own Balanced Diet Images and Printable Nutrition Charts
Creating attractive, accurate nutrition visuals requires consistent photography and clear annotation. Below are how-to steps and practical tips for DIY creators, educators, and clinicians.
-
Step 1 — Plan shot lists: decide which meals and portion sizes you’ll photograph. Include close-ups for portion guides and overhead shots for plate composition.
-
Step 2 — Standardize your plates and props: use the same plate color and size across photos so proportions remain comparable. Neutral backgrounds reduce distraction.
-
Step 3 — Use consistent lighting and angles: natural light and a 90-degree overhead angle work best for plate recognition. Avoid harsh shadows that obscure portion edges.
-
Step 4 — Annotate with clear, concise labels: overlay text that states cup/oz equivalents, macronutrient hints, and short nutrient-density notes. Use simple icons for protein, fiber, vitamins, and fats.
-
Step 5 — Validate portion sizes: cross-check your labels with trusted references like USDA MyPlate or nutrition-analysis software. When in doubt, consult a registered dietitian. For macro-specific layouts, review the macro meal planner guide.
-
Step 6 — Design printable charts: create PDF-friendly layouts with high-contrast fonts and space for handwritten notes. Include a one-line disclaimer about individual needs and a reference to authoritative sources (USDA, CDC, Academy of Nutrition and Dietetics).
-
Step 7 — Test with users: show your visuals to several people unfamiliar with the design and ask them to estimate portions and meals; iterate based on where they misinterpret labels. This provides practical experience feedback that improves clarity.
Graphic tips: use color-coding for food groups (green = vegetables, orange = grains, purple = protein, blue = dairy), and keep iconography simple. Save charts in high-resolution PDF formats for printing.
Transition: Ready-made downloadable charts speed adoption—below are recommended printable resources and how to use them.
Printable Balanced Diet and Nutrition Charts (Downloadable)
Below are practical printable resources you can use immediately. Each entry includes a description and usage instructions so you know how to integrate them with meal images.
-
Daily Plate Chart (printable PDF) — A single-page plate graphic with labeled sectors for fruits/vegetables, grains, protein, and dairy. Usage: print and tape to the fridge as a daily reminder. Pair with photographed meal examples to match each sector.
-
Weekly Meal Planner with Image Slots — A two-page printable with space to affix photos or sketches of planned meals and boxes for grocery quantities. Usage: plan Sunday shopping using the image bank. For more printable weekly menu structures, see the meal planner printable guide.
-
Portion Visual Cheat Sheet — Single-sheet guide showing hand comparisons, everyday object analogies, and serving size conversions. Usage: carry a laminated copy in a wallet or hang in the kitchen. For portion strategies in weight loss contexts, consult the portion control for weight loss guide.
-
Macro Snapshot Cards — 3″x5″ cards that list target macronutrient ranges for common meals (breakfast, lunch, dinner) with small photo illustrations. Usage: tuck in a planner or hand to clients for quick reference. For deeper macro planning, see the macro meal planner guide.
-
Vitamin & Mineral Quick Chart — One-page reference that pairs foods with notable micronutrient contributions (e.g., spinach = iron, citrus = vitamin C). Usage: include alongside meal images to highlight nutrient-rich choices; see the healthy food vitamin chart guide.
-
Printable Food Swap Card Deck — Small cards suggesting simple plate swaps (e.g., white rice → quinoa, creamy dressing → lemon-tahini). Usage: place on pantry door as prompts during meal prep.
Authority links and resources: For official MyPlate graphics and downloadable USDA materials, visit the USDA MyPlate site. USDA MyPlate
For population nutrition statistics that justify programmatic use of visuals, reference CDC nutrition surveillance reports. CDC Nutrition
Need structured worksheets? The healthy diet worksheet guide offers downloadable formats tuned to home and clinic use.
Transition: Below are concise, targeted FAQs addressing common concerns when using balanced diet images and charts.
FAQs About Balanced Diet Images and Nutrition Charts
Below are short, practical answers to frequently asked questions about using visuals and printable charts to plan balanced meals.
Transition to conclusion: After the FAQs, read the summary and final recommendations for implementing these tools at home or in educational settings.
Conclusion
Balanced diet images and printable nutrition charts transform abstract guidance into actionable meals. Use annotated photos to show macronutrient distribution, apply portion-size visuals to estimate servings, and integrate printable charts into weekly meal planning. These tools—aligned with USDA MyPlate and Academy guidance—make healthy eating easier to practice daily. Start by photographing three favorite balanced meals, annotating portions with the steps above, and printing a weekly planner to reinforce habits.
Disclaimer: This guide provides general information and visuals for education and meal planning; individual nutrient and calorie needs vary. Consult a registered dietitian or healthcare provider for personalized advice.
Call to action: Download a starter Daily Plate Chart, photograph one balanced meal this week, and use the printable checklist for seven days to see measurable improvements in portion control and vegetable intake.
Frequently Asked Questions
What are balanced diet images and why are they important?
Balanced diet images are annotated photos showing food groups, portion sizes, and macronutrient cues; they simplify complex nutrition guidance and help people translate recommendations into real meals for better portion control and nutrient density.
How do balanced diet images differ from a traditional food pyramid?
Balanced diet images (plate-focused) show real-meal proportions and portion sizes on one plate, while a food pyramid is hierarchical across food groups; plate visuals are more practical for single-meal decisions and portion estimation.
How can I use images of a balanced meal to improve my eating habits?
Use annotated meal photos as templates: match your plate to the photo’s portions, check off food-group boxes on a printable chart, and swap items using suggested alternatives to gradually align meals with visual guidance.
What are the best ways to create printable nutrition charts for meal planning?
Design simple PDFs with an annotated plate, portion cheat-sheet, and weekly checklist; standardize fonts and icons, validate serving sizes with USDA/MyPlate references, and include space for substitutions and notes.
How long does it take to plan meals using balanced diet visuals and charts?
Initial setup (photo bank and printable templates) may take 1–2 hours; after that, weekly planning using image slots and a printable checklist typically takes 20–45 minutes depending on complexity.
What should I do if the balanced diet images don’t match my dietary restrictions?
Adapt visuals by swapping foods within the same food group (e.g., legumes for meat, fortified plant milk for dairy) and note restrictions on the printable chart; consult a dietitian for specialized guidance.
Are printable nutrition charts accurate for tracking daily nutrient intake?
Printable charts are excellent for tracking servings and food-group balance, but they provide approximate nutrient estimates; use them for behavioral goals and consult nutrition analysis tools for precise intake tracking.
How can I ensure the quality and reliability of balanced diet images and charts I find online?
Prefer materials aligned with USDA MyPlate, CDC data, or Academy of Nutrition and Dietetics guidance; check publication dates (within five years) and verify portion labels against authoritative references.