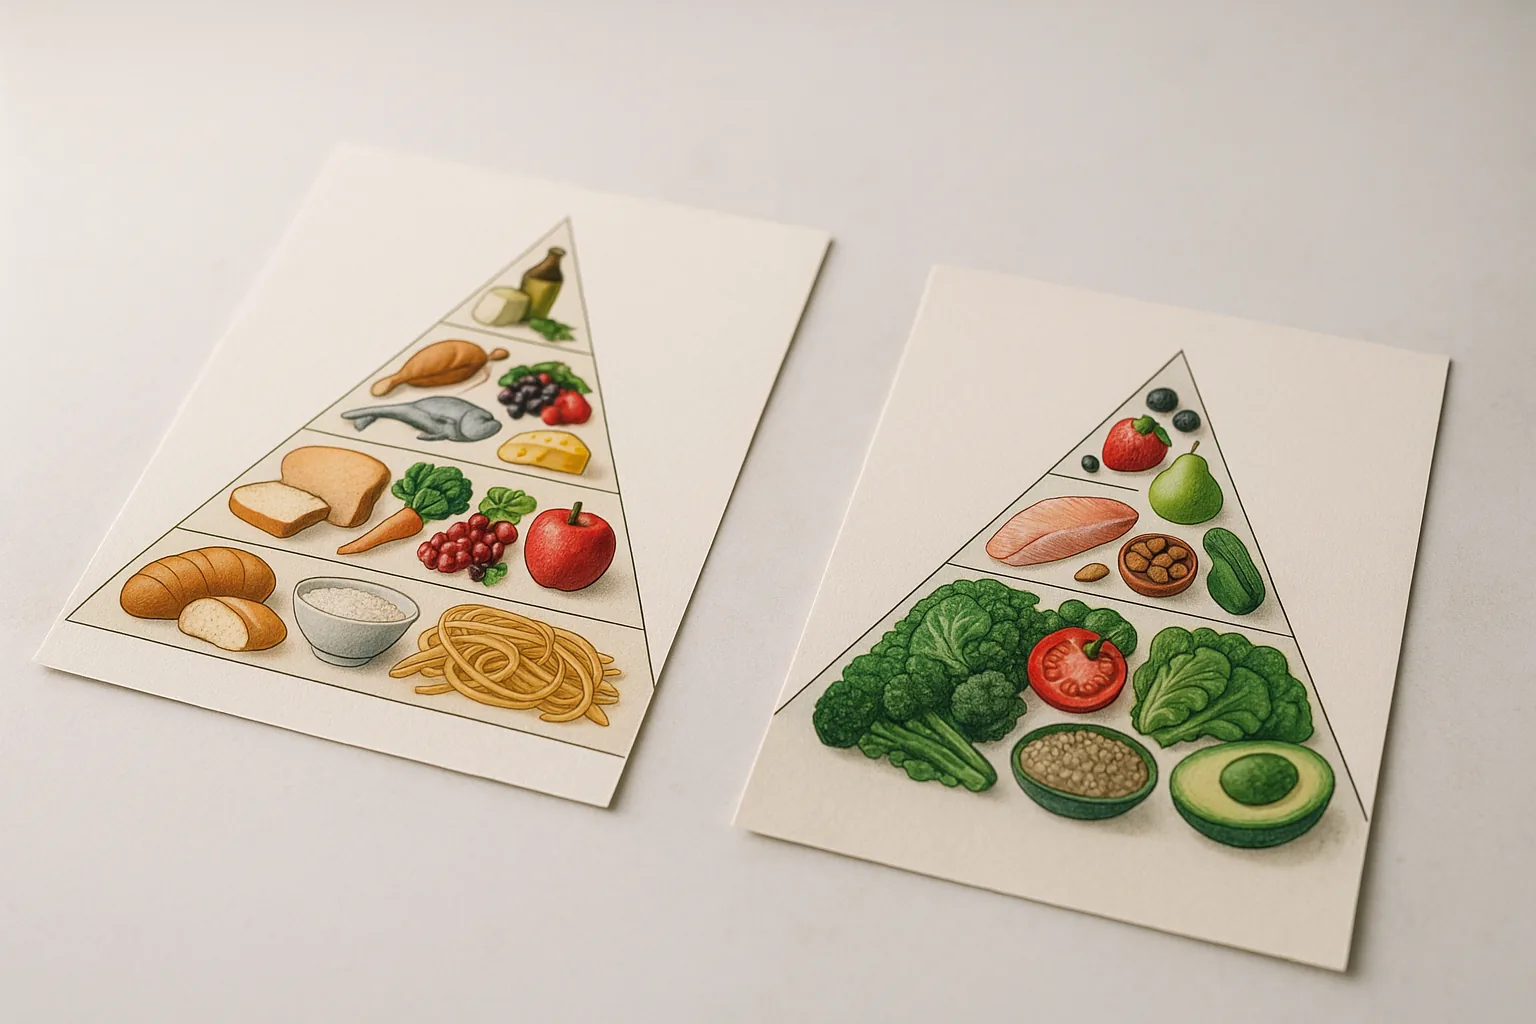
The old food pyramid was a hierarchical USDA visual guide that prioritized grains at the base and recommended daily servings by group; comparing it to MyPlate and newer pyramids shows clearer portioning, more emphasis on vegetables and whole foods, and nuanced macronutrient guidance informed by evolving evidence and public health outcomes.
Old food pyramid: The USDA’s 1992 hierarchical visual guide that grouped foods into layers to recommend daily servings by food group.
Transitioning now to a focused historical overview clarifies how that early guidance started and why it mattered.
Introduction to the Old Food Pyramid?
Answer: The Old Food Pyramid was created by the USDA in 1992 as a simple visual tool to communicate daily food-group servings—grains at the base, fruits and vegetables in the middle, with dairy, protein, fats and sweets at the top—intended to simplify national dietary guidance for the public and institutions.
The USDA introduced the pyramid to translate nutrient-based recommendations into an easy-to-follow graphic for schools, hospitals, and households. It prioritized food groups rather than nutrients, recommending multiple daily servings of breads, cereals, rice, and pasta as the foundation for energy needs.
USDA guidelines: Federal publications translating nutrition science into public recommendations for healthy eating patterns and portion guidance.
The pyramid’s public-health use included school lunch planning, community education campaigns, and federal nutrition programs. According to the USDA’s archived materials, the pyramid was central to messaging throughout the 1990s and early 2000s and influenced institutional menus and educational materials (source type: USDA historical publication).
diet definition helps distinguish an individual’s habitual eating pattern from prescriptive guides like the pyramid.
Early adoption relied on simplicity: layered visuals, numeric serving ranges, and a one-size-fits-most framing. That clarity drove uptake but also seeded later critiques about oversimplification and insufficient nutrient-level guidance.
Next, examine the pyramid’s building blocks to see what each layer intended to deliver nutritionally.
Structure and Components of the Old Food Pyramid?
Answer: The Old Food Pyramid organized foods into a five-tier hierarchy—grains; vegetables; fruits; dairy; protein—with fats and sweets as the small tip, each tier paired with recommended daily serving ranges to guide energy and nutrient intake.
Serving sizes: The recommended quantities per food group intended to translate nutrient needs into familiar foods; these were generalized daily portions rather than individualized calorie targets.
-
Grains (base): The pyramid placed breads, cereals, rice, and pasta at the foundation, recommending the largest number of servings daily (commonly 6–11 servings in the original guide). The emphasis was on energy-providing carbohydrates as staples; later critiques noted limited guidance on whole versus refined grains.
carbohydrate consistency for health - Vegetables: Recommended several servings daily, intended to supply fiber, vitamins (like A and K), and minerals. The pyramid grouped all vegetables together without differentiating starchy from non-starchy choices or encouraging variety by color and subtypes.
- Fruits: Fruits were paired with vegetables as essential sources of vitamins, fiber, and phytonutrients, with multiple daily servings encouraged but lacking specific guidance on whole fruit versus juice.
-
Dairy: Milk, yogurt, and cheese were shown as a separate tier, reflecting calcium, vitamin D (via fortification), and protein roles; recommended servings sought to support bone health without individualized lactose or fat-intake considerations.
adequate intake for nutrients - Protein foods: Meat, poultry, fish, dry beans, eggs, and nuts formed another tier, with recommended servings intended to meet essential amino acid and micronutrient needs; the pyramid did not strongly differentiate between lean and high-saturated-fat protein sources.
-
Fats, oils, and sweets (tip): The small apex signaled limited intake for high-fat and high-sugar items; however, the guidance grouped all fats together without distinguishing unsaturated from saturated fats in a prescriptive way.
serving size guide
The pyramid’s numeric serving approach implicitly mapped to macronutrient distribution: a higher percentage of calories from carbohydrates (grains, starchy vegetables), moderate protein, and limited fats. Macronutrients: carbohydrates, proteins, and fats—the primary categories of dietary energy—were addressed indirectly by food-group servings rather than explicit percentage ranges.
Practical notes: the pyramid assumed an average adult energy requirement and therefore offered broad ranges rather than individualized calorie or macronutrient prescriptions, a limitation for populations with differing needs such as athletes, older adults, or regional dietary patterns.
With the structural map clear, the next section evaluates the most common critiques that emerged as nutritional science progressed.
Critiques and Limitations of the Old Food Pyramid?
Answer: Major critiques of the Old Food Pyramid focus on oversimplified messaging, grain-heavy bias, inadequate differentiation of food quality (refined vs. whole), and limited guidance on portion control and fats—factors that contributed to misinterpretation and unintended public-health impacts.
The criticisms developed from observational evidence, dietary surveillance, and expert review over time. Below are the key critiques summarized for clarity:
- Nutrient imbalance and grain bias: Advocates argued that the pyramid’s heavy grain base implicitly endorsed high carbohydrate intake without adequate emphasis on whole-grain quality or glycemic impact.
- Oversimplification: Grouping diverse foods together (e.g., all fats, all proteins) obscured important distinctions in nutrient density and health outcomes.
- Portion confusion: Serving counts were abstract; many consumers lacked clear serving-size visuals, contributing to overeating despite following the guide.
- Public health misapplications: Institutions used the pyramid’s guidance rigidly for menu planning, sometimes reinforcing calorie-dense or refined-grain choices in school or institutional meals.
- Diet quality considerations: The pyramid did not adequately address dietary patterns, food processing, added sugars, or the role of dietary fats beyond “limit.”
These limitations interacted with broader dietary patterns—such as the prevalence of processed foods in the Standard American Diet—which amplified health issues like rising obesity and cardiometabolic disease risk. Standard American Diet issues
Public-health campaigns later emphasized food quality, diversity, and portion control as corrective responses to the pyramid’s blunt groupings.
Having covered critiques, the next section summarizes modern replacements and how they attempt to address these issues.
Overview of Modern Nutrition Models (MyPlate and New Food Pyramid)?
Answer: Modern models like MyPlate (2011) and subsequent USDA visual guides reframe guidance as proportion-based plate pieces or stepped pyramids, emphasizing vegetables, fruits, whole grains, lean proteins, and proportion over hierarchical serving counts to improve clarity and reflect updated evidence.
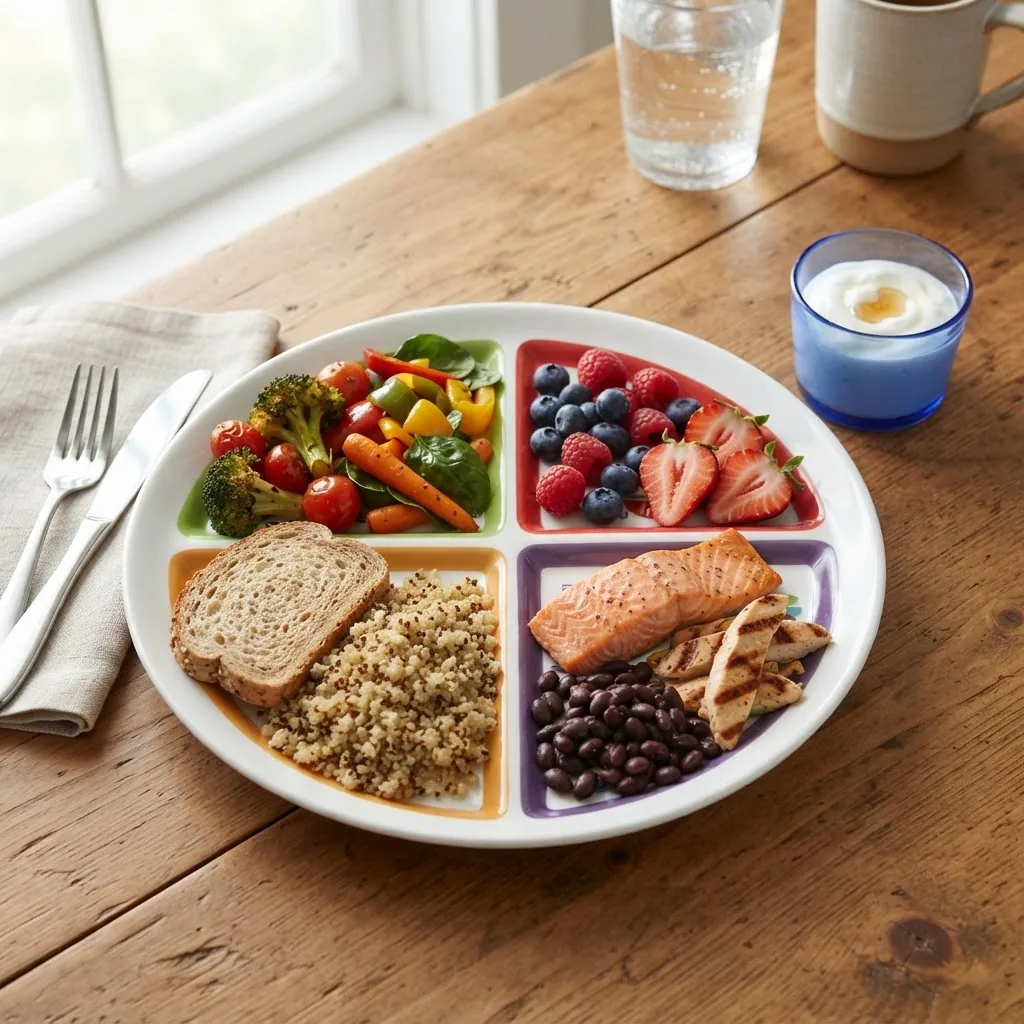
MyPlate: A 2011 USDA visual dividing a plate into proportional sections for vegetables, fruits, grains, and protein with a side dairy icon, designed to show meal-level portioning instead of daily serving ranges.
According to the 2023 USDA Dietary Guidelines (source type: USDA Dietary Guidelines publication), updated messaging stresses dietary patterns, food quality (e.g., whole grains, unsaturated fats), and nutrient-dense choices. The USDA Dietary Guidelines shifted language away from rigid servings to more flexible, pattern-based recommendations.
Another modern approach, sometimes described as a New Food Pyramid or MyPyramid (2005) and its successors, used color-coded vertical bands or stepped segments to communicate energy balance and physical activity alongside food groups. These models increasingly integrated behavior and lifestyle cues.
For an in-depth summary of updated USDA recommendations and how they differ from the old pyramid, see the New Food Pyramid guidance. new food pyramid recommendations
| Model | Core visual | Primary focus |
|---|---|---|
| Old Food Pyramid (1992) | Layered pyramid | Daily servings by food group; grain-first framing |
| MyPyramid / New Pyramid (2005–present) | Vertical colored bands / steps | Activity, balance, and individualized portions |
| MyPlate (2011) | Divided plate | Meal-level proportioning; emphasize vegetables and balance |
External public-health organizations like the American Heart Association complement USDA guidance with heart-healthy specifics—limits on saturated fat, added sugars, and sodium—further shaping how models are applied in clinical and community settings (source type: American Heart Association guidance).
After this overview, the next section compares features directly to show practical differences and trade-offs.
Comparing the Old Food Pyramid to MyPlate and Other Models?
Answer: Compared side-by-side, the Old Food Pyramid emphasizes daily serving counts and a grain-first hierarchy, whereas MyPlate prioritizes meal-level proportions—both aim for balance but differ in clarity on portion visuals, food quality, and individualized guidance.
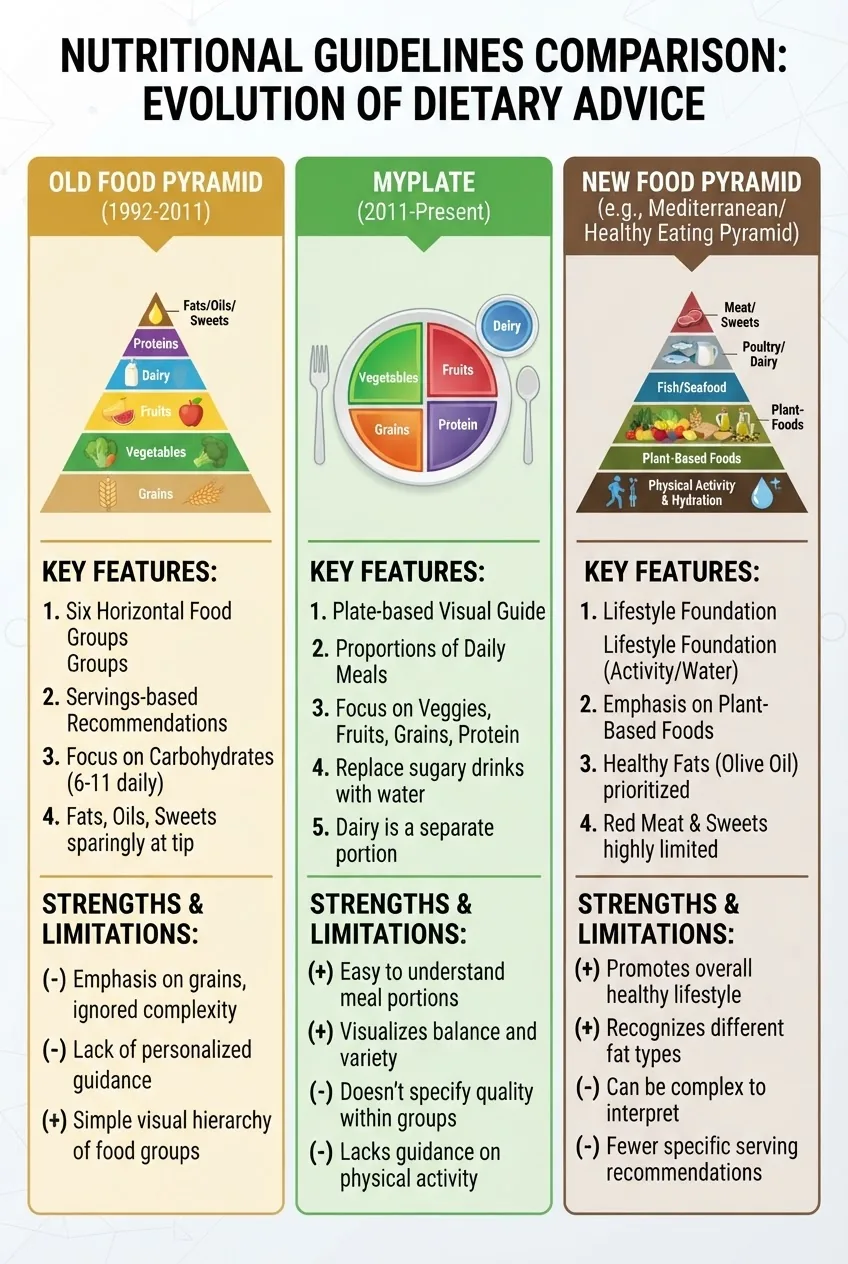
| Feature | Old Food Pyramid | MyPlate / New Pyramid |
|---|---|---|
| Visual focus | Hierarchy and serving counts | Plate portions and balance at meals |
| Food-quality guidance | Limited; grouped foods together | Emphasizes whole grains, veggies, lean proteins |
| Portion clarity | Abstract servings; fewer visuals | Visual meal-level portions, easier for plate planning |
| Individualization | One-size-fits-most serving ranges | Encourages pattern adjustment by calorie needs |
Practical pros and cons:
- Old Pyramid pro: Simple, memorable hierarchy useful for institutional planning; con: insufficient nuance on food processing or portion visuals.
- MyPlate pro: Actionable for meal assembly and visual learners; con: less explicit daily nutrient totals and sometimes lacks guidance on portion sizes for energy needs.
- New Pyramid/MyPyramid pro: Integrates activity and tailored servings; con: some designs were criticized as cluttered and less intuitive than a plate.
visual guides for healthy meals aid translating these differences into actual plates and menus.
food pyramid and plate models provides an extended comparative library of visuals and examples.
Transitioning from comparison to evidence: how well does MyPlate stand up when tested against research and outcomes?
How Accurate Is MyPlate? Scientific Evaluation and Critiques?
Answer: MyPlate is directionally accurate—promoting vegetables, fruits, whole grains, and lean proteins—but scientific evaluations show mixed effectiveness for behavior change unless paired with education, portion guidance, and contextualized dietary counseling.
Research assessments in peer-reviewed outlets show that MyPlate’s strength lies in its intuitive meal-level framing, which can improve vegetable and fruit visibility in meals, but the model alone often does not change caloric intake or macronutrient balance without supportive interventions (source type: peer-reviewed nutrition studies).
Evidence highlights:
- Behavioral studies report modest increases in fruit/vegetable selection following MyPlate-based education but limited sustained change in overall diet quality without longer interventions (source type: peer-reviewed trial reports).
- Comparative analyses suggest MyPlate’s meal-focused message is easier to operationalize than abstract servings, yet it requires portion-control tools to address calorie intake (source type: nutrition behavior research).
- Systematic reviews conclude that visual guides are effective when integrated with policy, access to healthy foods, and targeted communication (source type: systematic review in nutrition journals).
Major critiques from scientists include the need for clearer messaging on food quality (e.g., whole vs. refined grains), quantitative portion cues for different calorie needs, and culturally tailored examples to improve relevance. For authoritative framing, see publications by the Journal of Nutrition and reviews indexed on PubMed (source type: peer-reviewed journals).
Given mixed but generally supportive evidence, MyPlate is accurate as a high-level, behavior-oriented tool but not a standalone clinical prescription—effective implementation depends on education, portion tools, and community food environments.
Next, apply these principles to local Texas food environments and practical meal planning steps.
Practical Implications for Balanced Diet Planning in Texas Today?
Answer: Texans can apply lessons from the pyramid and MyPlate by prioritizing local produce, whole grains, lean proteins, and portion-aware meal assembly—adapting patterns to regional food availability, cultural preferences, and individual energy needs to meet balanced diet principles.
balanced diet principles provide the foundation: diverse vegetables and fruits, whole grains, lean protein, limited added sugars and saturated fats, and attention to portion size.
How-to steps for practical planning in Texas:
- Assess seasonal/local availability: Use farmer’s markets (e.g., summer tomatoes, winter greens) to maximize nutrient density and support cost-effective choices.
- Build plate-first meals: Follow MyPlate’s meal-portion idea—half the plate vegetables and fruits, one quarter whole grains, one quarter lean protein, with dairy as appropriate.
- Portion control tools: Use measuring cups or a portion plate to translate MyPlate into real servings tailored to calorie needs; this reduces ambiguity that arose with the Old Pyramid.
- Cultural adaptation: Incorporate regional staples—e.g., beans, grilled lean meats, corn in whole form—while prioritizing preparation methods that reduce added fats and sodium.
- Plan for energy needs: Adjust portion sizes for activity level and weight goals; consider consulting meal-plan guides for templates.
For readers seeking structured meal templates:
- balanced weight loss nutrition plans offer lower-calorie examples aligned with portion control.
- healthy balanced diet plans provide modestly higher-energy templates for active adults.
- balanced nutrition guide is the central resource for foundational education on food-group balance.
- optimizing energy through food choices for activity-aligned food selection.
- balanced meals and nutrition needs for everyday meal examples.
Actionable Texan menu idea: build a weekday plate with local grilled fish or pinto beans (protein), a corn and poblano stir with brown rice (whole grain), and a large mixed salad topped with citrus and avocado (veggies/fruits and healthy fats). Pair with low-fat yogurt or milk if dairy is included.
For those wanting printable tools or worksheets to apply these steps, see resources like meal planners and portion-plate guides available on the site.
Finally, synthesize the lessons from historical models into concluding guidance.
Conclusion: Lessons from the Old Food Pyramid for Modern Nutrition Guidance?
Answer: The Old Food Pyramid taught the value of simple public messaging but also exposed the need for food-quality nuance, portion clarity, and adaptable guidance; modern models correct many gaps, and the practical lesson is to combine clear visuals with individualized portions, food-quality emphasis, and local adaptation.
Key takeaways:
- Use visuals (plate or pyramid) to plan meals, but translate them into portion amounts that match energy needs.
- Prioritize whole foods—vegetables, fruits, whole grains, lean proteins—and distinguish refined/added-sugar items as limited.
- Apply guidance in culturally appropriate, region-specific ways—Texas menus can leverage beans, seasonal produce, and lean grilling methods.
- Pair visual models with education and policy for real behavior change—visuals alone are rarely sufficient.
If you want actionable meal templates or portion guides tailored to your goals, explore our meal-plan resources or consult a registered dietitian for individualized translation of these principles.