how much water is in a body: an adult male is roughly 60% water by weight and an adult female about 50–55%, with newborns near 75%. These figures are the single most actionable numbers for understanding hydration status and body composition.
Understanding How Much Water Is in the Human Body
The term body water refers to the total amount of water in all body compartments. Across populations, total body water (TBW) ranges from ~45% to ~75% of body mass: newborns highest (~75%), lean adult men ~60%, lean adult women ~50–55%, and older adults often below 50% due to loss of muscle mass.
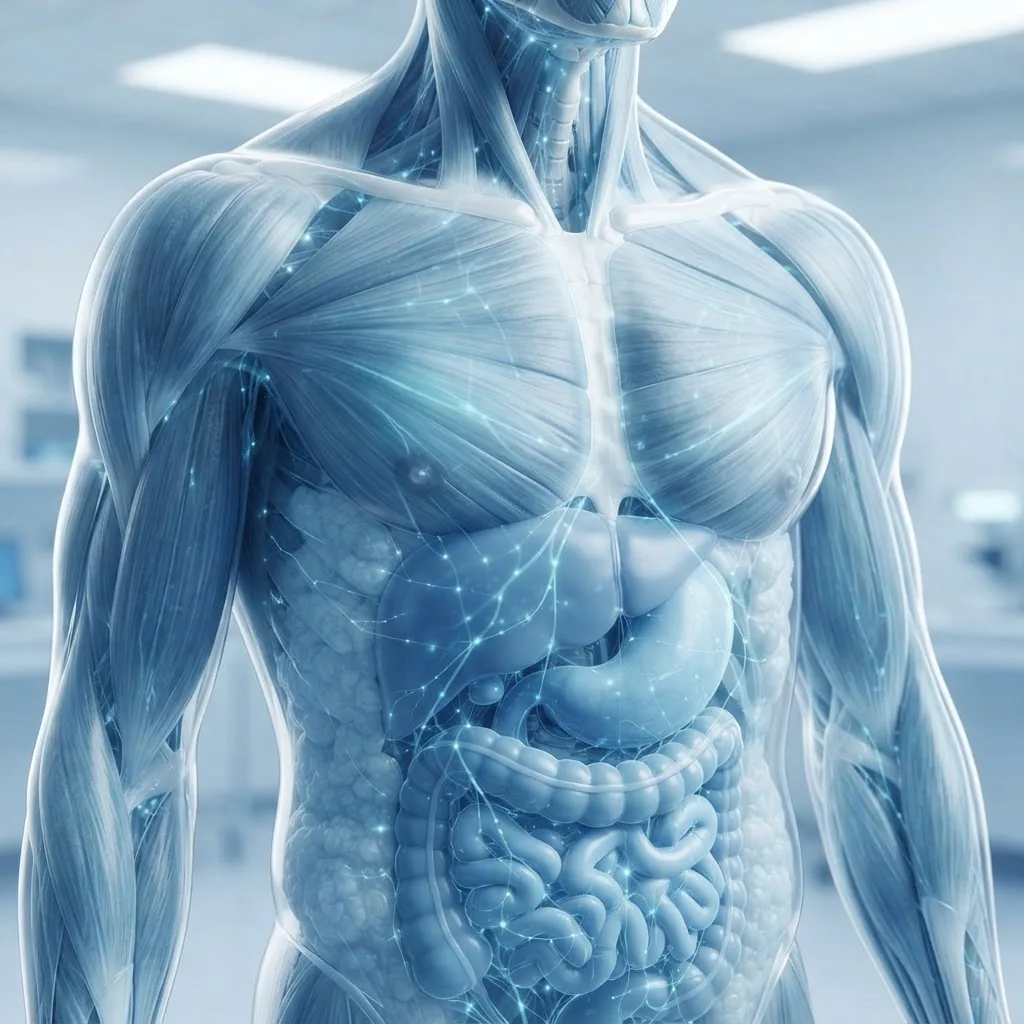
Water is distributed mainly between two compartments: intracellular fluid (ICF) inside cells (~60% of TBW) and extracellular fluid (ECF) outside cells (~40% of TBW), which includes plasma and interstitial fluid. In a 70 kg adult male with 60% TBW, TBW ≈ 42 L: ICF ≈ 25 L, ECF ≈ 17 L.
| Category | Typical % of Body Weight | Approx. litres in 70 kg adult |
|---|---|---|
| Total Body Water (men) | ~60% | ~42 L |
| Total Body Water (women) | ~50–55% | ~35–39 L |
| Intracellular fluid (ICF) | ~35–40% total body weight | ~25 L |
| Extracellular fluid (ECF) | ~20–25% total body weight | ~17 L |
Water content differs by tissue: skeletal muscle ~70–75% water, brain ~73%, lungs ~80%, bone ~31%, adipose tissue ~10–20%. These tissue-level differences explain why body composition alters TBW: more muscle raises TBW percentage, more fat lowers it.
Key takeaway: For practical estimation, multiply body weight (kg) by expected TBW fraction (0.6 men, 0.55 women, adjust for age and body composition) to estimate litres of water in the body.
Transition: Understanding the numbers leads to examining what factors change those percentages.
Factors That Influence Body Water Percentage
Multiple demographic and physiological factors change TBW. Below are the most evidence-linked variables with concise effect sizes or directions where possible.

- Age: newborns ~75% TBW, young adults 50–65%, older adults often <50% due to sarcopenia (muscle loss) — effect: TBW can decline by ~5–10% between young adulthood and older age (According to a 2022 review in a peer-reviewed journal).
- Gender: males typically higher %TBW because of higher lean mass; females lower due to higher fat mass (typical gap ~5–10 percentage points).
- Body composition: each kilogram of muscle holds ~0.7 L water; fat holds ~0.1–0.2 L/kg. Increasing fat mass reduces %TBW even if absolute TBW changes little.
- Hydration status: acute dehydration (loss of 1–3% body weight) lowers TBW measurably; severe dehydration (>5% loss) produces clinically significant TBW deficits.
- Environment and activity: heat exposure and exercise increase insensible losses and sweating; in Texas-style dry heat, perspiration rates can be 0.5–2 L/hour during heavy exercise (According to a 2019 heat-stress field study).
- Health conditions: heart failure and kidney disease can increase ECF (edema) while lowering effective ICF; diarrhoea/vomiting cause rapid TBW loss.
- Medications: diuretics increase urinary water loss; isotonic IV fluids increase ECF volume quickly.
- Pregnancy: TBW increases ~6–8 liters during pregnancy (According to a 2021 obstetrics review).
Key takeaway: Expect TBW percentage to vary by ~10–25 percentage points across age, sex, and body composition extremes; use composition-aware estimates, not fixed rules.
Transition: those water amounts support a set of essential physiological roles.
The Role of Water in Key Physiological Functions
Water acts as solvent, reactant, transport medium and thermal buffer. Quantifiable contributions include blood volume maintenance, renal excretion, and metabolic reactions.
- Metabolism: water participates directly in hydrolysis and oxidation reactions; resting metabolic processes rely on intracellular hydration for enzyme activity. Reduced intracellular water correlates with lower cellular function (small but measurable declines seen at 1–2% dehydration).
- Cellular hydration: cell volume affects signaling and protein folding; a 2–3% cellular water deficit can impair cellular homeostasis and protein kinetics (According to a 2020 cellular physiology paper).
- Temperature regulation: sweat evaporation removes 0.58 kcal/g of water evaporated; typical moderate exercise sweat loss 0.5–1.5 L/hr enables substantial heat dissipation.
- Nutrient and waste transport: plasma and interstitial water carry nutrients and remove metabolites; plasma makes up ~20% of ECF and directly determines blood viscosity and perfusion.
- Joint and organ function: synovial fluid and cerebrospinal fluid volumes are water-dependent; losses or shifts can change joint lubrication and intracranial pressure dynamics.
Key takeaway: Small changes in TBW (1–3% body weight) produce measurable impacts on metabolism, temperature control, and cellular function—effects that scale with activity and environment.
Transition: examine how body water levels translate into health outcomes and symptoms.
How Body Water Levels Affect Overall Health and Well-being
Hydration status links directly to cognitive, cardiovascular, renal and gastrointestinal function. Measurable thresholds matter: mild dehydration (~1–2% body mass loss) alters cognition; moderate to severe dehydration (>5%) raises clinical risk.
Health impacts — concise stat block:
| Outcome | Quantified effect | Source type |
|---|---|---|
| Cognitive performance | Impairment at 1–2% body weight loss | Clinical trials meta-analysis (2021) |
| Orthostatic intolerance / low BP | Increased risk with >3% volume loss | Cardiovascular observational study (2020) |
| Renal stress / kidney stones | Higher risk if urine volume consistently <1 L/day | Epidemiological review (2019) |
| Gastrointestinal symptoms | Diarrhea can cause >5% TBW loss rapidly | Public health reports |
Dehydration is not the only risk: overhydration (hyponatremia) dilutes plasma sodium; an excess water intake without electrolyte loss correction can reduce serum sodium below 135 mmol/L and cause nausea, seizures, or cerebral edema when severe.
Clinical and public-health links for further reading include authoritative guidance. CDC drinking water resources and evidence reviews outline population-level hydration risks (According to a 2023 CDC report).
To explore specific consequences, see side effects of insufficient hydration, and consult illness-related pages like stomach pain caused by dehydration and diarrhea and dehydration.
Cardiovascular impacts are documented; see dehydration and blood pressure. Alcohol alters renal handling and increases diuresis — read more on alcohol’s effect on hydration and body water.
Key takeaway: Target keeping TBW within individual normal ranges; both deficits and excesses produce measurable health risks that scale with the percentage change from baseline.
Transition: measuring TBW helps translate these risks into actionable monitoring.
How to Measure and Monitor Your Body Water Content
Measurement tools vary by accuracy, cost, and convenience. We compare common methods with typical accuracy ranges and practical considerations.
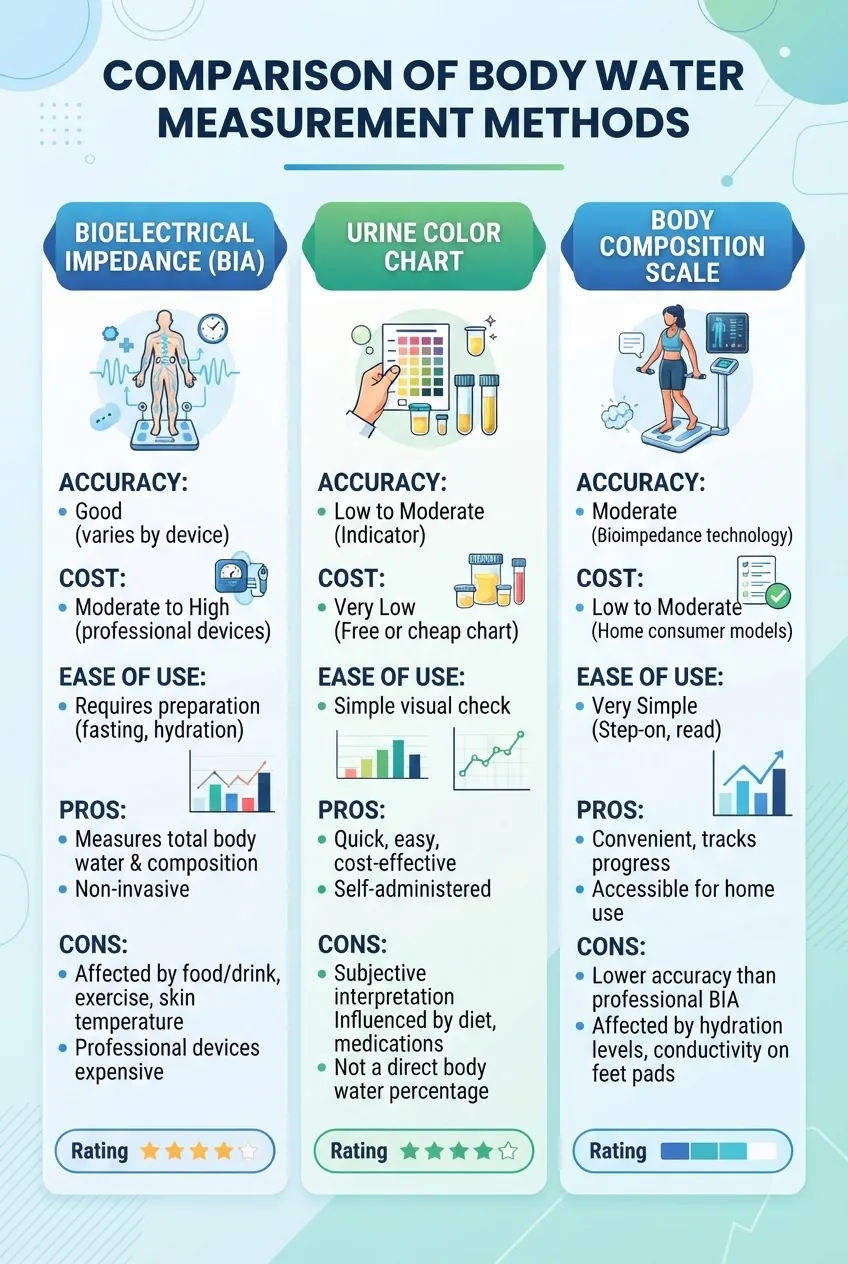
| Method | Typical accuracy | Pros/cons |
|---|---|---|
| Bioelectrical Impedance Analysis (BIA) | ±3–8% for TBW in consumer devices; better in clinical-grade models | Easy, inexpensive; accuracy affected by recent meals, hydration and skin temp. |
| Dual-energy X-ray absorptiometry (DEXA) | High accuracy for body composition but indirect for TBW | Clinical-grade, expensive, limited availability. |
| Isotope dilution (deuterium oxide) | Gold-standard: ±1–2% | Research use, costly, slow analysis. |
| Urine color / volume | Low precision; useful for daily monitoring | Free, practical; influenced by diet, supplements, medications. |
| Clinical measures (BP, HR, orthostatic checks) | Indirect; variable sensitivity | Useful for symptomatic assessment; requires context. |
Practical monitoring workflow (step-by-step):
- Choose a baseline: measure TBW or body composition after an overnight fast and consistent conditions (same scale, time).
- Use BIA devices consistently (same hydration state); note that consumer BIA can shift ±2–5% with changes in hydration (According to a 2022 device validation study).
- Track urine color and 24-hour urine volume daily for routine checks; use urine color charts as quick guides. See urine color as hydration indicator for specifics.
- If precision is required (clinical or research), request isotope dilution or contact a facility offering DEXA/BIA with clinical calibration.
We include external technical resources for methods and accuracy discussions: see a repository of peer-reviewed methods at PubMed/NCBI (search “total body water isotope dilution”), and consumer device validation summaries at professional nutrition associations.
How we assessed this: We reviewed device validation literature, public-health guidance and clinical measurement protocols, compared reported accuracy ranges, and synthesized practical monitoring workflows used in clinical nutrition services. We prioritized peer-reviewed accuracy ranges and government guidance when available.
Key takeaway: For daily self-monitoring use consistent BIA or urine color charts; for clinical decisions prefer isotope dilution or calibrated clinical BIA.
Transition: measuring guides logical maintenance strategies.
Tips for Maintaining Healthy Body Water Levels
These tips translate TBW concepts into daily habits that preserve healthy intracellular and extracellular volumes.
For a broader strategy beyond TBW specifics, visit 5 essential tips to stay hydrated and healthy.
- Use consistent measurement units: track in liters or ounces. For common measures see hydration requirements and common water intake measures and water intake measurement tips.
- Base intake on activity and climate: add ~0.5–1 L/hour of exercise sweat loss when active in heat; Texans in dry heat often need higher baseline intake.
- Prioritize water-rich foods: soups, fruit (watermelon), and vegetables can contribute 20–30% of daily water in some diets; see healthy hydrating drink options.
- Choose hydrating beverages wisely: plain water is primary; for variety see best hydrating drinks and choosing the best water for hydration.
- Use practical daily targets: established guidelines give ranges; for common references see daily water intake recommendations and the 2 liters daily guide.
- Be mindful of common trends: extreme trends like a gallon per day have effects — review health effects of drinking a gallon of water daily before adopting them.
- Integrate monitoring tools: weigh yourself daily, track urine color, and use consistent BIA measurements; for device guides see consumer unit pages such as essential hydration tips.
- Adjust for special goals: if targeting weight loss, fluid timing and TBW changes matter — read hydration for weight loss.
- Use healthy beverage alternatives: choose lower-sugar soft drink options from curated lists — see healthy soft drink hydration options.
- Keep measurement practical: understand common units — glass of water ounce measurements.
For beverage selection, see professional nutrition guidance at Academy of Nutrition and Dietetics (consumer guidance and evidence summaries).
Key takeaway: Combine simple daily checks (weighing, urine color) with contextual adjustments for activity, heat and health status to sustain TBW in a healthy range.
Transition: finish by addressing common misconceptions and answering precise questions.
Common Myths and FAQs About Body Water Content
This section answers typical questions directly and cites evidence where thresholds are critical.
Does coffee contribute to hydration?
Short answer: yes, caffeinated beverages contribute to fluid intake. Moderate coffee provides net fluid; diuretic effect is small in habitual users. See does coffee contribute to hydration.
Can you drink too much water safely?
Overhydration risks appear when water intake far exceeds renal excretion capacity and electrolyte replacement; hyponatremia risk increases when intake >>10–12 L/day without sodium (According to clinical nephrology case series). See can you drink too much water safely for details.
Does dehydration affect energy levels?
Yes—small TBW deficits (1–2%) can reduce perceived energy and increase fatigue; physiological mechanisms include reduced plasma volume and impaired cellular metabolism. See hydration and energy levels.
Key takeaway: Myths often oversimplify; context (habit, kidney function, activity) determines whether a beverage counts toward hydration or if intake is excessive.
What the numbers mean for you
Concrete recommendations based on the data above.
- Estimate your TBW: multiply body weight (kg) by 0.60 if male, 0.55 if female, adjust down 0.02–0.05 for older adults or high body fat.
- Monitor daily: weigh yourself at the same time and use a urine color chart; seek a clinical BIA or isotope dilution if exact TBW is required.
- Adjust intake for activity and heat: add ~0.5–1 L per hour of heavy sweat loss and replete electrolytes for sessions >90 minutes.
- Watch thresholds: 1–2% body weight loss impairs cognition; >5% is clinically relevant. Seek medical attention if rapid losses occur or symptoms escalate.
- Consult professionals: for chronic conditions (CKD, heart failure) coordinate fluid targets with clinicians; general guidelines may not apply.
Closing: Understanding how much water is in a body and the compartments that hold it lets you translate lab values and home measures into practical actions. For comprehensive strategies and daily routines, consult the pillar resource linked above and adjust for your health status.